Cortana Analytics

Cortana Analytics

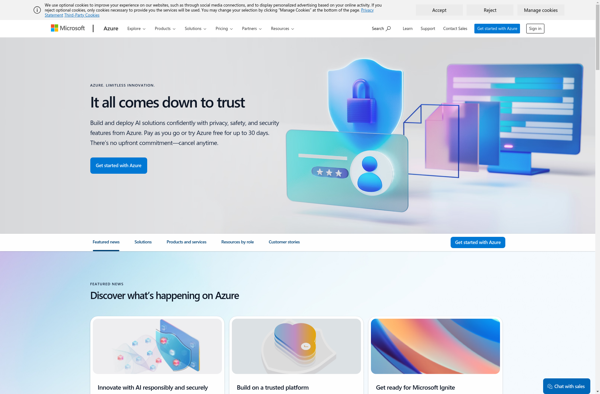
Cortana Analytics is a suite of business intelligence and analytics tools from Microsoft. It includes services like Azure Machine Learning for predictive analytics, Azure Data Lake for big data storage and analytics, Power BI for data visualization, and others.
Cortana Analytics image
analytics business-intelligence data-visualization machine-learning microsoft

Cortana Analytics: Business Intelligence Tools

A suite of business intelligence and analytics tools from Microsoft, including predictive analytics, big data storage and analytics, and data visualization

What is Cortana Analytics?

Cortana Analytics is an integrated suite of intelligence tools and services from Microsoft designed to help organizations make data-driven decisions. It includes the following core components:

  • Azure Machine Learning - A cloud service for building and deploying predictive analytics solutions and machine learning models
  • HDInsight - Managed Hadoop, Spark, and other big data services on Azure
  • Azure Data Lake - A highly scalable repository for storing massive amounts of structured and unstructured data
  • Power BI - Interactive data visualization tools for creating reports, dashboards and visualizations
  • Azure Stream Analytics - Real-time analytics and complex event processing on streaming data from IoT devices and applications

Key capabilities of Cortana Analytics include collecting and storing a wide variety of data at scale, preparing and transforming the data for analysis, building and training predictive models with machine learning, applying advanced analytics for real-time processing of streaming data, and creating insightful visualizations and interactive reports for data sharing and collaboration.

By integrating these services into a comprehensive platform, Cortana Analytics enables organizations to unlock the value from their data assets to gain important business insights, stay ahead of emerging trends, and make precise recommendations and accurate automated decisions in real-time.

Cortana Analytics Features

Features

  1. Machine learning
  2. Big data analytics
  3. Real-time stream processing
  4. Data integration
  5. Visualization and reporting

Pricing

  • Pay-As-You-Go
  • Subscription-Based

Pros

Integrates well with other Microsoft products

Scalable to handle large data workloads

Built-in machine learning capabilities

Flexible pricing options

Cons

Steep learning curve

Can be expensive for large deployments

Mostly tailored to Microsoft-centric environments


The Best Cortana Analytics Alternatives

Top Ai Tools & Services and Analytics and other similar apps like Cortana Analytics


Tableau icon

Tableau

Tableau is a leading business intelligence and data visualization platform used by organizations of all sizes to transform their data into easy-to-understand visualizations and dashboards. With Tableau, users can connect to a wide range of data sources, prepare and clean the data for analysis, and create interactive data visualizations such...
Tableau image
QlikView icon

QlikView

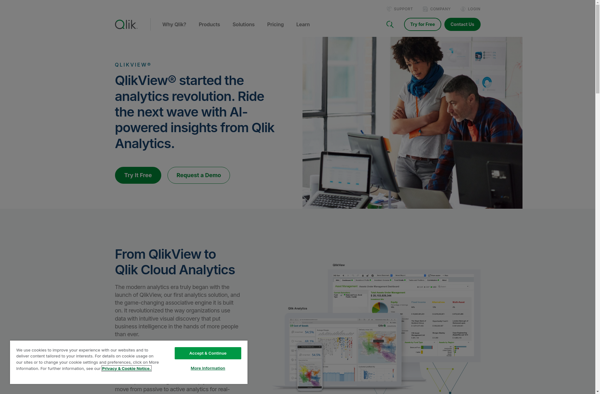
QlikView is a business intelligence and data visualization platform used to create interactive dashboards and analytics applications. It was first released in 1993 by the Swedish company Qlik. Key features of QlikView include:Associative data modeling and in-memory analytics engine - Allows fast analysis of large, disparate datasets without predefined schema...
QlikView image
Sisense icon

Sisense

Sisense is a business intelligence and data analytics software platform designed to help non-technical users prepare, analyze and visualize complex data. Some key features of Sisense include:Intuitive drag-and-drop interface for building interactive dashboards and visualizations like charts, graphs and pivot tables without coding.Ability to connect to wide variety of data...
Sisense image
Amazon QuickSight icon

Amazon QuickSight

Amazon QuickSight is a fast, cloud-powered business intelligence service that makes it easy to build visualizations, perform ad-hoc analysis, and quickly get business insights from your data. Some key features include:Intuitive visual interface that makes it easy to visualize and explore dataBroad data connectivity to connect to data sources like...
Amazon QuickSight image
QueryTree icon

QueryTree

QueryTree is a visual SQL analytics software designed to make query building fast and easy for any skill level. It features an intuitive drag-and-drop interface that allows users to construct complex SQL queries visually without typing code.Some key features of QueryTree include:Visual query builder with drag-and-drop fields and quick type...
QueryTree image
Keeeb icon

Keeeb

Keeeb is an open-source, keyboard-focused note taking and productivity app for Windows, Mac and Linux operating systems. It is designed specifically for power users who prefer to use keyboard shortcuts over reaching for the mouse.Some of the key features of Keeeb include:Quick note taking - easily capture thoughts, notes, web...
Keeeb image
Marple icon

Marple

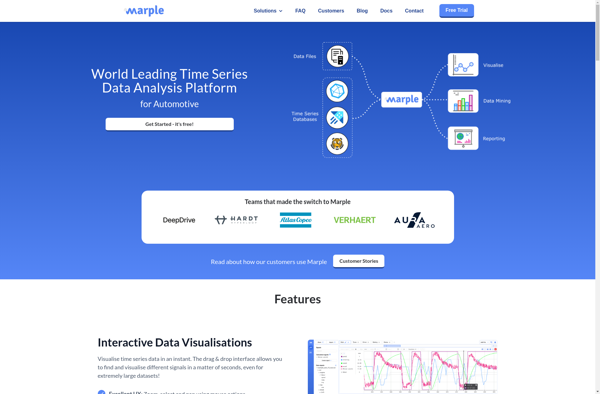
Marple is an open-source, Markdown-based slide deck tool for creating presentations. It provides a minimalistic editor interface to write slide content in Markdown format, which then gets rendered into an elegant slide deck for presenting.Some key features of Marple:Write slide content in easy-to-read and write Markdown format. Format headings, lists,...
Marple image
Zoho Analytics icon

Zoho Analytics

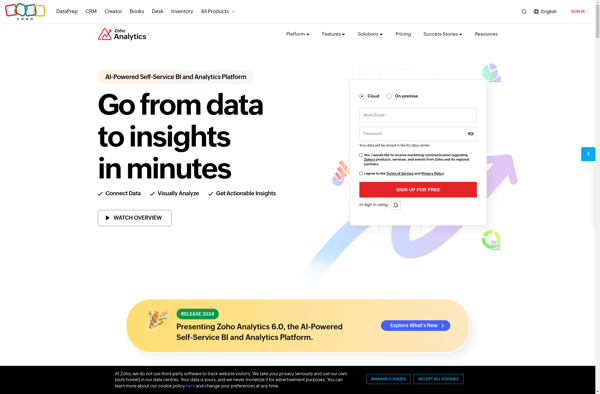
Zoho Analytics is a powerful yet user-friendly business intelligence and data analytics platform used by organizations of all sizes. It allows you to connect data from multiple sources including databases, cloud apps, and files, enabling a unified view of business data.With an intuitive drag-and-drop interface, Zoho Analytics makes it easy...
Zoho Analytics image
KiniMetrix icon

KiniMetrix

KiniMetrix is a cloud-based software platform designed for healthcare providers to help them better manage their practices, engage with patients, gain population health insights, and handle administrative tasks. It combines features typically found in separate electronic health record (EHR), practice management, patient portal and business intelligence solutions into one unified...
DataPad icon

DataPad

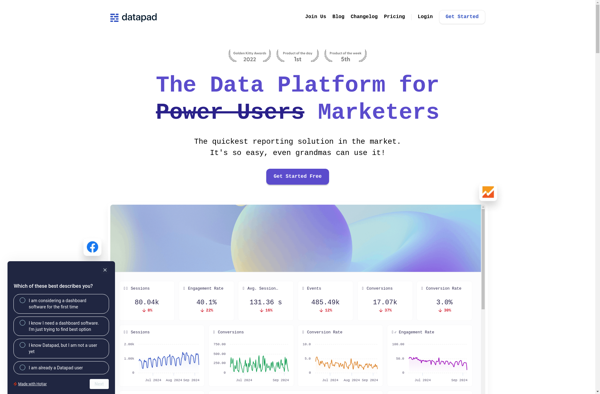
DataPad is a user-friendly data analysis and visualization software designed for researchers of all levels. With its intuitive drag-and-drop interface, DataPad allows users to easily import, clean, analyze and visualize complex datasets without coding.Key features include:Import data from CSV, Excel, databases and other sourcesInteractive drag-and-drop workflow to clean, analyze and...
DataPad image