KiniMetrix icon

KiniMetrix

KiniMetrix is a software platform used by healthcare providers to manage their practices and patients. It includes features like electronic health records, patient engagement tools, population health insights, and practice management and billing.

What is KiniMetrix?

KiniMetrix is a cloud-based software platform designed for healthcare providers to help them better manage their practices, engage with patients, gain population health insights, and handle administrative tasks. It combines features typically found in separate electronic health record (EHR), practice management, patient portal and business intelligence solutions into one unified system.

Key features of KiniMetrix include:

  • Electronic Health Records (EHR) - Records patients' medical history, medications, allergies, test results, visit details and more digitally instead of paper charts.
  • Practice Management - Handles scheduling, billing and claims submission. Integrates with EHR data.
  • Patient Portal - Enables patients to access their health information, communicate with providers, schedule appointments and pay bills online.
  • Business Intelligence - Analytics and reporting provide insights about practice metrics, revenue, quality measures and population health outcomes.
  • Device Connectivity - Connects diagnostic devices like blood pressure cuffs to automatically record readings in patients' EHRs.
  • Mobile Access - iOS and Android apps allow access to EHR data and practice management features on the go.

By combining all these capabilities into one platform, KiniMetrix aims to provide an efficient, integrated information system to streamline workflows for healthcare providers and improve quality of care delivery.

The Best KiniMetrix Alternatives

Top Apps like KiniMetrix

Microsoft Power BI, Tableau, JasperReports, SQL Server Reporting Services, Talend, Looker Studio, QlikView, Pentaho, Sisense, Amazon QuickSight, Jedox, dotnet Report Builder, ReportServer, Marple, InfoCaptor Dashboard, Domino Data Lab, Platfora, Datawatch, Sense Platform, Cortana Analytics, GoodData, Centius Qi, Sybase IQ, Nucleon BI Studio, Jolicharts, KPI watchdog are some alternatives to KiniMetrix.

Microsoft Power BI

Microsoft Power BI is a powerful business analytics service developed by Microsoft. It empowers users to transform raw data into meaningful insights, create interactive reports and dashboards, and share data-driven stories within an organization. Power BI is designed to help businesses and individuals make informed decisions based on a comprehensive...

Tableau

Tableau is a leading business intelligence and data visualization platform used by organizations of all sizes to transform their data into easy-to-understand visualizations and dashboards. With Tableau, users can connect to a wide range of data sources, prepare and clean the data for analysis, and create interactive data visualizations such...

JasperReports

JasperReports is an open source Java reporting library that can generate various types of reports from different data sources. It is very flexible and offers many features:Supports connecting to various data sources like SQL databases, NoSQL databases, XML, JSON, CSV files, etc.Can generate reports in multiple formats including...

SQL Server Reporting Services

SQL Server Reporting Services (SSRS) is a comprehensive enterprise reporting platform from Microsoft that allows users to create and deliver interactive, mobile-ready reports across the organization. SSRS can connect to almost any data source to build rich, interactive reports with charts, maps, sparklines and more.Key features and capabilities of...

Talend

Talend is an open source data integration and management platform designed to help organizations effectively collect, transform, cleanse and share data across systems and teams. Some key capabilities and benefits of Talend include:Graphical drag-and-drop interface to build data integration jobs and workflows without codingOver 900 pre-built data connectors to leading...

Looker Studio

Looker Studio is a business intelligence and analytics platform designed to help companies analyze data and gain valuable insights. It provides an intuitive, web-based interface that enables users without technical skills to explore, visualize and share data easily.Some key capabilities and benefits of Looker Studio include:Interactive dashboards -...

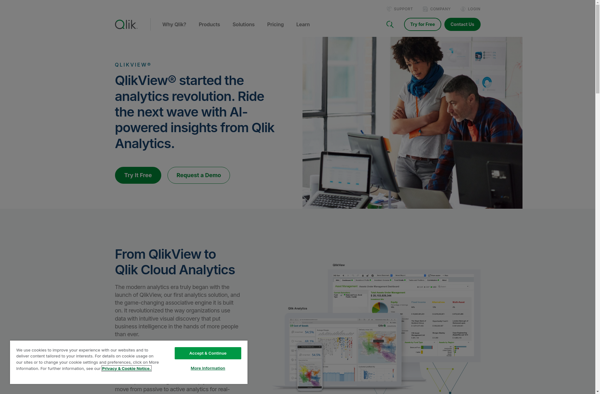
QlikView

QlikView is a business intelligence and data visualization platform used to create interactive dashboards and analytics applications. It was first released in 1993 by the Swedish company Qlik. Key features of QlikView include:Associative data modeling and in-memory analytics engine - Allows fast analysis of large, disparate datasets without predefined schema...

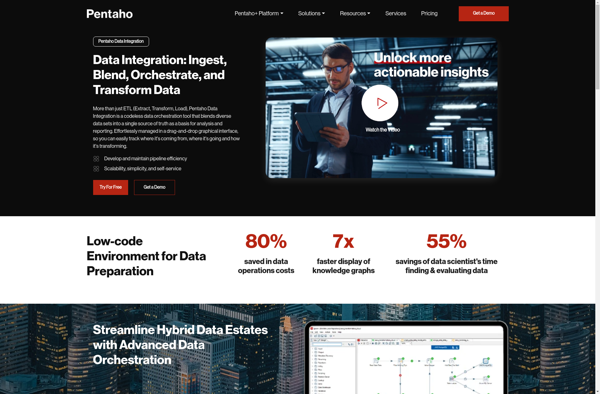
Pentaho

Pentaho is a comprehensive open source business intelligence (BI) suite that provides a range of data integration, analytics, visualization, reporting, data mining, and workflow capabilities. It is designed to help businesses consolidate data from disparate sources for unified analytics and reporting.Some of the key capabilities and components of Pentaho...

Sisense

Sisense is a business intelligence and data analytics software platform designed to help non-technical users prepare, analyze and visualize complex data. Some key features of Sisense include:Intuitive drag-and-drop interface for building interactive dashboards and visualizations like charts, graphs and pivot tables without coding.Ability to connect to wide variety...

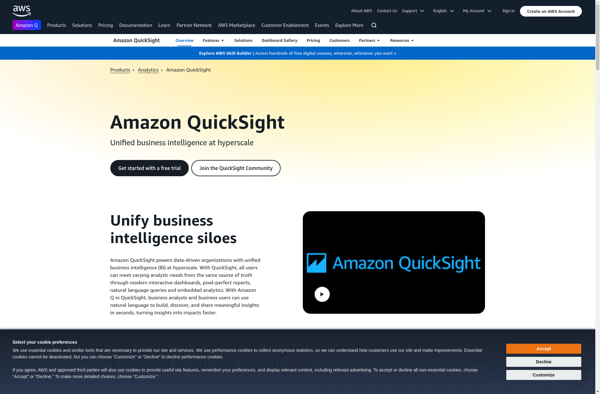
Amazon QuickSight

Amazon QuickSight is a fast, cloud-powered business intelligence service that makes it easy to build visualizations, perform ad-hoc analysis, and quickly get business insights from your data. Some key features include:Intuitive visual interface that makes it easy to visualize and explore dataBroad data connectivity to connect to data sources...

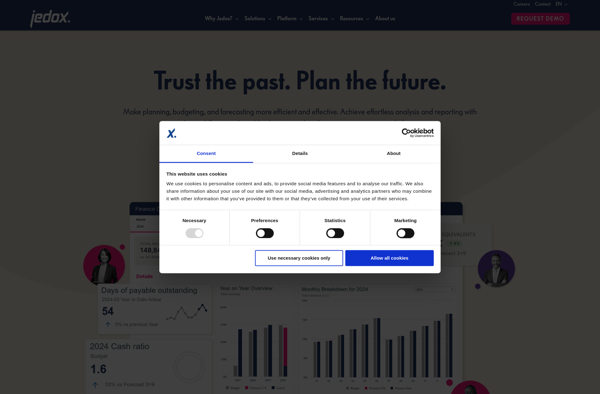
Jedox

Jedox is a comprehensive business intelligence and corporate performance management platform designed for mid-size to large enterprises. It provides a wide range of capabilities including:Multi-dimensional online analytical processing (OLAP) for complex data analysis and modelingPlanning, budgeting, and forecasting features for financial planning and simulationCustomizable dashboards and self-service reporting for...

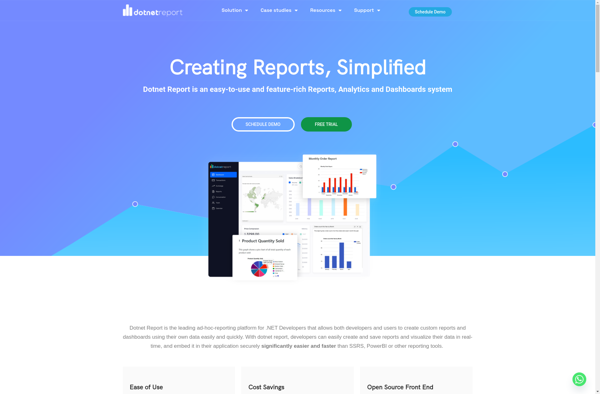
Dotnet Report Builder

dotnet Report Builder is an open-source reporting tool designed specifically for .NET applications. It allows .NET developers to create rich, customizable reports for both web and desktop applications with minimal coding.Some key features of dotnet Report Builder include:Supports connecting to various data sources like SQL Server, Oracle, MongoDB...

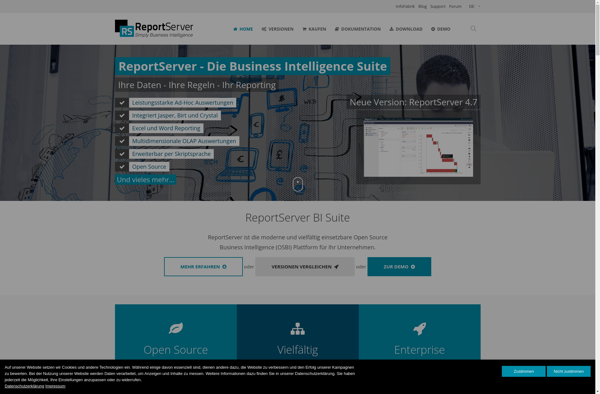
ReportServer

ReportServer is an open source business intelligence and reporting platform used to create and distribute interactive reports and dashboards. It supports connecting to various relational and NoSQL databases, flat files, REST APIs, and other data sources to build reports.Some key capabilities and benefits of ReportServer include:Ad-hoc reporting for...

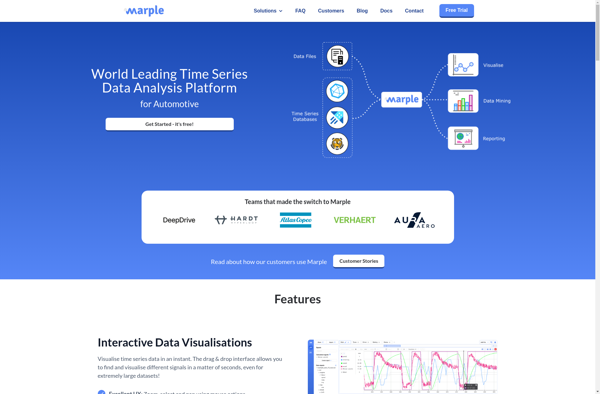
Marple

Marple is an open-source, Markdown-based slide deck tool for creating presentations. It provides a minimalistic editor interface to write slide content in Markdown format, which then gets rendered into an elegant slide deck for presenting.Some key features of Marple:Write slide content in easy-to-read and write Markdown format. Format...

InfoCaptor Dashboard

InfoCaptor Dashboard is a business intelligence and analytics platform designed to help companies consolidate their data, create customized dashboards and reports, and uncover valuable insights. Some key features of InfoCaptor Dashboard include:Data connectivity and ETL - Connect to data from multiple sources like SQL and NoSQL databases, cloud apps...

Domino Data Lab

Domino Data Lab is an end-to-end platform for data science teams to collaboratively build, deploy, and monitor analytical models. It brings together data science workloads across the model development lifecycle with integrated security, governance, and automation capabilities.Key capabilities and benefits of Domino Data Lab include:Centralized workspace for data...

Platfora

Platfora is a big data analytics software designed to help companies make sense of large and complex datasets. It provides an interactive visual interface that allows business users to analyze big data without needing to know how to code.Some key features of Platfora include:Intuitive visual workflows for exploring...

Datawatch

Datawatch is a business intelligence and analytics platform designed for self-service data preparation, reporting and visualization. Some key capabilities and features of Datawatch include:Data Connectivity - Datawatch can connect to a wide variety of data sources like databases, applications, flat files, big data platforms and more. It provides connectivity...

Sense Platform

Sense Platform is an open-source business intelligence and analytics platform designed to make complex data stacks understandable and accessible to everyone across an organization. It provides a full range of tools for data integration, analysis, and visualization to help companies understand and extract valuable insights from their data.Some key...

Cortana Analytics

Cortana Analytics is an integrated suite of intelligence tools and services from Microsoft designed to help organizations make data-driven decisions. It includes the following core components:Azure Machine Learning - A cloud service for building and deploying predictive analytics solutions and machine learning modelsHDInsight - Managed Hadoop, Spark, and other...

GoodData

GoodData is a business intelligence and analytics platform used by companies to collect, store, and analyze their data to drive business decisions. Some key capabilities and features of GoodData include:Data warehousing and ETL - GoodData ingests data from various sources, transforms it, and loads it into a cloud data...

Centius Qi

Centius Qi is an intuitive, code-free business automation platform powered by artificial intelligence. It helps companies eliminate manual processes, automate repetitive tasks, and streamline workflows across the organization.With an easy-to-use drag and drop interface, Centius allows anyone to build workflows, set up integrations, create intelligent chatbots, gather actionable insights...

Sybase IQ

Sybase IQ is an analytical database management system optimized for data warehousing, analytics, and business intelligence. It utilizes a column-oriented storage model designed to provide higher performance for analytic queries while using lower storage space compared to row-oriented databases.Key features and capabilities of Sybase IQ include:Column-oriented storage and...

Nucleon BI Studio

Nucleon BI Studio is a self-service business intelligence and analytics platform used by organizations to visualize, analyze, and share data insights. It provides an intuitive drag-and-drop interface that enables users without technical skills to easily build interactive dashboards, reports, and workflows to gain actionable insights from their data.Key capabilities...

Jolicharts

Jolicharts is a feature-rich JavaScript charting library that allows you to easily add interactive charts and graphs to web applications and dashboards. With Jolicharts, you can create over 30 types of charts including line charts, bar charts, pie charts, scatter plots, stacked bar charts and more.Some key features of Jolicharts...

KPI watchdog

KPI Watchdog is a robust business intelligence and data analytics platform designed to help companies track, analyze, and visualize key performance indicators (KPIs) in real-time. It provides powerful, customizable dashboards and reporting tools to monitor essential metrics across all departments and roles.With KPI Watchdog, businesses can connect data from...