Centius Qi icon

Centius Qi

Centius Qi is an AI-powered business automation platform that helps streamline workflows and automate repetitive processes. It allows users to easily build workflows, integrate systems, create chatbots, gather insights, and automate tasks without coding.

What is Centius Qi?

Centius Qi is an intuitive, code-free business automation platform powered by artificial intelligence. It helps companies eliminate manual processes, automate repetitive tasks, and streamline workflows across the organization.

With an easy-to-use drag and drop interface, Centius allows anyone to build workflows, set up integrations, create intelligent chatbots, gather actionable insights from data, and more - no coding required. It connects seamlessly to popular business apps like Salesforce, Marketo, Slack, and Office 365.

Key features and benefits include:

  • Workflow Automation - Visual workflow builder to model processes and trigger automatic responses and follow up actions.
  • AI-Powered Bots - Create conversational bots to handle routine customer/employee requests.
  • Application Integration - Connect to business apps without coding via 500+ pre-built integrations.
  • Analytics & Reporting - Get data-driven insights to optimize operations.
  • Native Mobile App - Manage workflows on-the-go.

Industries like retail, manufacturing, finance use Centius to save time, boost productivity, improve CX, and increase revenue. It's an ideal automation tool for non-technical users focused on digital transformation and operational efficiency.

Official Links

The Best Centius Qi Alternatives

Top Apps like Centius Qi

Microsoft Power BI, Tableau, JasperReports, QlikView, Alteryx, Pentaho, Spotfire, Sisense, QueryTree, GridGain In-Memory Data Fabric, KiniMetrix are some alternatives to Centius Qi.

Microsoft Power BI

Microsoft Power BI is a powerful business analytics service developed by Microsoft. It empowers users to transform raw data into meaningful insights, create interactive reports and dashboards, and share data-driven stories within an organization. Power BI is designed to help businesses and individuals make informed decisions based on a comprehensive...

Tableau

Tableau is a leading business intelligence and data visualization platform used by organizations of all sizes to transform their data into easy-to-understand visualizations and dashboards. With Tableau, users can connect to a wide range of data sources, prepare and clean the data for analysis, and create interactive data visualizations such...

JasperReports

JasperReports is an open source Java reporting library that can generate various types of reports from different data sources. It is very flexible and offers many features:Supports connecting to various data sources like SQL databases, NoSQL databases, XML, JSON, CSV files, etc.Can generate reports in multiple formats including...

QlikView

QlikView is a business intelligence and data visualization platform used to create interactive dashboards and analytics applications. It was first released in 1993 by the Swedish company Qlik. Key features of QlikView include:Associative data modeling and in-memory analytics engine - Allows fast analysis of large, disparate datasets without predefined schema...

Alteryx

Alteryx is a data preparation and analytics software platform designed to make advanced data analytics accessible to any data worker. It provides an end-to-end platform to ingest, prepare, blend, analyze, and visualize data to gain deeper insights faster.Some key capabilities and benefits of Alteryx include:Intuitive drag-and-drop interface to...

Pentaho

Pentaho is a comprehensive open source business intelligence (BI) suite that provides a range of data integration, analytics, visualization, reporting, data mining, and workflow capabilities. It is designed to help businesses consolidate data from disparate sources for unified analytics and reporting.Some of the key capabilities and components of Pentaho...

Spotfire

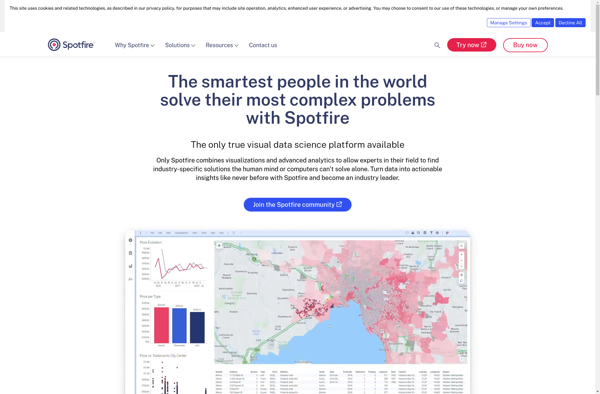
Spotfire is a business intelligence and analytics software platform designed for interactive data discovery and visualization. It enables rapid analysis of large, complex data sets to uncover deeper insights.Key features of Spotfire include:Interactive dashboards and visualizations - Drag-and-drop interface to create customized data visualizations like heat maps, charts...

Sisense

Sisense is a business intelligence and data analytics software platform designed to help non-technical users prepare, analyze and visualize complex data. Some key features of Sisense include:Intuitive drag-and-drop interface for building interactive dashboards and visualizations like charts, graphs and pivot tables without coding.Ability to connect to wide variety...

QueryTree

QueryTree is a visual SQL analytics software designed to make query building fast and easy for any skill level. It features an intuitive drag-and-drop interface that allows users to construct complex SQL queries visually without typing code.Some key features of QueryTree include:Visual query builder with drag-and-drop fields and...

GridGain In-Memory Data Fabric

GridGain In-Memory Data Fabric is a distributed in-memory computing platform that enables organizations to develop data-intensive applications that require high performance and massive scalability. It provides an in-memory data grid that can be accessed by applications, allowing them to store and process data with in-memory speeds.Some key capabilities and...

KiniMetrix

KiniMetrix is a cloud-based software platform designed for healthcare providers to help them better manage their practices, engage with patients, gain population health insights, and handle administrative tasks. It combines features typically found in separate electronic health record (EHR), practice management, patient portal and business intelligence solutions into one unified...