GridGain In-Memory Data Fabric
GridGain In-Memory Data Fabric

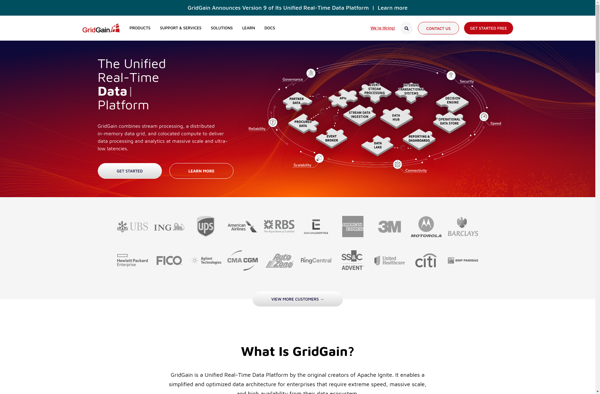
GridGain In-Memory Data Fabric is an in-memory computing platform that provides in-memory speed and massive scalability for data-intensive applications. It allows organizations to process transactions and analyze data in real-time.
GridGain In-Memory Data Fabric image
inmemory database data-grid distributed-computing

GridGain In-Memory Data Fabric

GridGain In-Memory Data Fabric is an in-memory computing platform that provides in-memory speed and massive scalability for data-intensive applications. It allows organizations to process transactions and analyze data in real-time.

What is GridGain In-Memory Data Fabric?

GridGain In-Memory Data Fabric is a distributed in-memory computing platform that enables organizations to develop data-intensive applications that require high performance and massive scalability. It provides an in-memory data grid that can be accessed by applications, allowing them to store and process data with in-memory speeds.

Some key capabilities and benefits of GridGain include:

  • Very fast in-memory access for both transactions and analytics resulting in orders of magnitude performance boost over disk-based solutions.
  • Support for hybrid transactional/analytical processing (HTAP) allowing transactional and analytical workloads to run simultaneously on the same in-memory dataset without impacting performance.
  • Distributed architecture that provides linear scalability by allowing to scale out across commodity servers as data and processing needs grow.
  • ANSI-99 SQL support including ACID transactions, JDBC drivers and automatic data partitioning across cluster for querying very large datasets.
  • MapReduce implementation and support for programming languages like Java, .NET, C++ for developing massively parallel analytical applications.
  • Event streaming and continuous SQL capabilities for streaming analytics and real-time predictive modelling.
  • Support for Kubernetes, Docker and OpenStack deployments as well as cloud platforms like AWS and Azure.

Overall, GridGain provides organizations with a high performance, scalable in-memory data platform for their critical transactional, analytical and streaming data workloads.

GridGain In-Memory Data Fabric Features

Features

  1. In-memory data storage and processing
  2. Distributed caching
  3. In-memory SQL queries
  4. In-memory compute grid
  5. High availability through data replication
  6. Horizontal scalability
  7. ACID transactions
  8. ANSI SQL support
  9. Streaming and CEP
  10. Machine learning and predictive analytics

Pricing

  • Open Source
  • Freemium
  • Subscription-Based

Pros

Very fast performance for data-intensive workloads

Low latency for real-time applications

Scales horizontally

Supports both SQL and key-value APIs

Open source and commercially supported options available

Cons

Can require large amounts of RAM to store data in-memory

Not ideal for storing large amounts of infrequently accessed data

Complexity of distributed system configuration and management


The Best GridGain In-Memory Data Fabric Alternatives

Top Development and In-Memory Databases and other similar apps like GridGain In-Memory Data Fabric


Crystal Reports icon

Crystal Reports

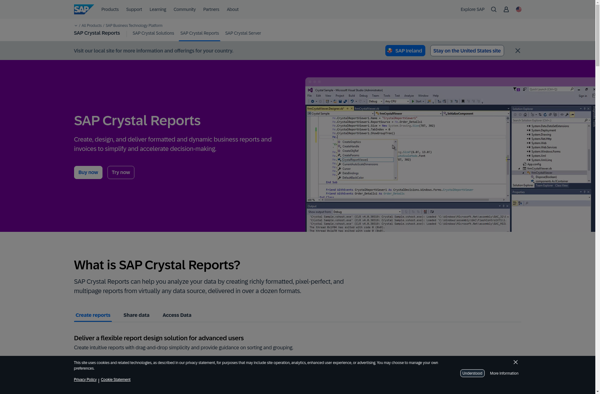
Crystal Reports is a flexible business reporting tool used to design and generate professional reports from virtually any data source. Originally created by Crystal Services and now owned by SAP, Crystal Reports has been around since the early 1990s and has become one of the most popular reporting tools used...
Crystal Reports image
PHP Report Maker icon

PHP Report Maker

PHP Report Maker is an open-source PHP library that allows generating PDF and Excel reports from various data sources including MySQL, PostgreSQL, MS SQL, SQLite, Oracle, and CSV files. It provides a simple API for custom report building and formatting using PHP, helping developers and businesses automate business reporting and...
PHP Report Maker image
Stimulsoft Reports icon

Stimulsoft Reports

Stimulsoft Reports is a flexible business intelligence and reporting tool used to design and generate various types of reports. It provides an intuitive visual report designer for quickly building rich data visualizations and formatted reports.With Stimulsoft, you can connect to a wide variety of data sources including SQL databases, NoSQL...
Stimulsoft Reports image
Thiicket icon

Thiicket

Thiicket is an open-source lightweight spreadsheet software that can be used as an alternative to Microsoft Excel. It provides basic spreadsheet functionalities for data entry, formatting, calculations and analysis.Some of the key features of Thiicket include:Entering and formatting data in cells like text, numbers, dates etc.Support for basic formulas and...
Thiicket image
ASP.NET Report Maker icon

ASP.NET Report Maker

ASP.NET Report Maker is an open-source reporting solution for ASP.NET web applications. It provides a drag-and-drop report designer for building rich data reports and dashboards that can be integrated seamlessly into ASP.NET projects.Key features include:Visual report designer for quick report buildingSupport for charts, tables, gauges, maps and other data visualizationsAbility...
ASP.NET Report Maker image
Valentina Reports icon

Valentina Reports

Valentina Reports is an open-source ad-hoc reporting tool that allows users to create rich visual reports and dashboards from various data sources including SQL & NoSQL databases, Excel, CSV files, Web APIs, and more. It has a graphical drag-and-drop report designer so users can build reports without coding.Key features include:Connectivity...
Valentina Reports image
Colombian Report Designer icon

Colombian Report Designer

Colombian Report Designer is a comprehensive reporting solution used to design, manage, and distribute a wide variety of business reports. With its intuitive drag-and-drop interface, users can easily create polished, professional-looking reports without coding.Some key features include:Drag-and-drop report designer with a wide selection of charts, tables, images, and other visual...
Colombian Report Designer image
DynamicReports icon

DynamicReports

DynamicReports is an open-source Java library for creating rich reports and dashboards. It provides a simple API for building complex layouts with tables, charts, images, and more without the need for specialized reporting tools.Some key features of DynamicReports:Runs on Java 8+ so integrates easily into Java web appsCreates PDF, Excel,...
DynamicReports image
CloudWork icon

CloudWork

CloudWork is a popular cloud-based project management and team collaboration software. It provides a wide range of features to help teams plan projects, assign tasks, manage workflows, track progress, and collaborate effectively.Some of the key features of CloudWork include:Intuitive dashboards and views - Gantt charts, Kanban boards, calendar views, and...
Apache Ignite icon

Apache Ignite

Apache Ignite is an open-source distributed database, caching, and processing platform designed for building real-time, scalable applications that need to process large data sets. It provides in-memory computing technologies such as a distributed key-value store, SQL and ACID-compliant transactions, data processing and analytics, and service grid.Key features of Ignite include:Distributed...
Apache Ignite image
Telerik Reporting icon

Telerik Reporting

Telerik Reporting is a powerful report generation tool used to create richly formatted reports from a variety of data sources. It offers extensive report authoring capabilities including support for charts, maps, tables, shapes, images and more to build visually compelling and interactive reports.Some key features of Telerik Reporting include:Connect to...
Telerik Reporting image
Oracle OLAP icon

Oracle OLAP

Oracle OLAP is an online analytical processing (OLAP) technology developed by Oracle Corporation as part of the Oracle Database. It allows users to analyze data across multiple dimensions with complex hierarchies and calculations at very fast speeds.Some key features of Oracle OLAP include:Multidimensional data model to capture business metrics and...
Oracle OLAP image
LogiXML icon

LogiXML

LogiXML is a business intelligence and analytics software platform used by organizations to access, analyze, visualize and share data. It allows companies to create interactive dashboards, pixel-perfect reports, and compelling data visualizations that provide actionable insights.Some key features of LogiXML include:Drag-and-drop interface to build reports and dashboards quickly without codingBroad...
LogiXML image
Domino Data Lab icon

Domino Data Lab

Domino Data Lab is an end-to-end platform for data science teams to collaboratively build, deploy, and monitor analytical models. It brings together data science workloads across the model development lifecycle with integrated security, governance, and automation capabilities.Key capabilities and benefits of Domino Data Lab include:Centralized workspace for data science teams...
Domino Data Lab image
KoolReport icon

KoolReport

KoolReport is an open-source PHP reporting library for faster and easier data reporting. Key features include:Easy and intuitive report creation with minimal codeSupport for variety of data sources: SQL databases, CSV/Excel files, etc.Various chart types including Line, Bar, Pie, Table, Pivot Table, Gauge Chart etc.Interactive reports and dashboardsExport reports to...
KoolReport image
Infinispan icon

Infinispan

Infinispan is an open source in-memory data grid and distributed cache written in Java. It offers extremely low latency and high availability for accessing data while also providing data reliability and resilience against failure.Infinispan works by distributing data across a cluster of servers running Infinispan nodes. The data is held...
Infinispan image
Datameer icon

Datameer

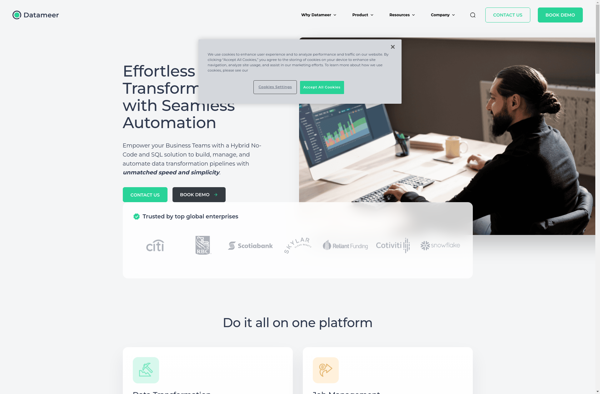
Datameer is an end-to-end data analytics and business intelligence platform built to enable organizations to extract valuable insights from massive datasets from various sources. It simplifies data integration, exploration, and analytics across Hadoop, Spark, cloud platforms, data warehouses, spreadsheets, and more.Key capabilities and benefits of Datameer include:Intuitive spreadsheet-like interface to...
Datameer image
Platfora icon

Platfora

Platfora is a big data analytics software designed to help companies make sense of large and complex datasets. It provides an interactive visual interface that allows business users to analyze big data without needing to know how to code.Some key features of Platfora include:Intuitive visual workflows for exploring datasetsIn-memory processing...
IcStorm icon

IcStorm

icStorm is an open-source, self-hosted agile project management application designed for small development teams. It offers similar core functionality as IceScrum, allowing teams to plan and track software projects using agile methodologies like Scrum and kanban.Key features of icStorm include:Customizable kanban boards to visualize workflow and track progressBacklogs for capturing...
IcStorm image
Cachelot icon

Cachelot

Cachelot is an open-source cache and session storage server written in Go. It is designed to be a fast, simple and scalable solution for caching data and sessions for web applications.Some key features of Cachelot include:In-memory storage for high performanceSimple JSON API over HTTPBuilt-in distributed caching and replicationDisk persistence for...
Cachelot image
Memcached icon

Memcached

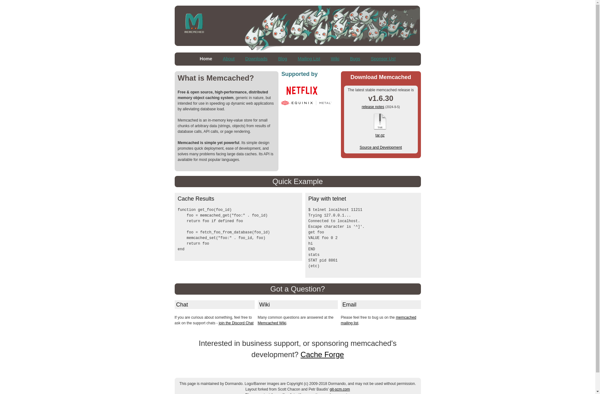
Memcached is an open source, high-performance distributed memory object caching system. It is designed to speed up dynamic web applications by caching data and objects in RAM to reduce the number of times an external data source (such as a database or API) needs to be read.Memcached is able to...
Memcached image
Sense Platform icon

Sense Platform

Sense Platform is an open-source business intelligence and analytics platform designed to make complex data stacks understandable and accessible to everyone across an organization. It provides a full range of tools for data integration, analysis, and visualization to help companies understand and extract valuable insights from their data.Some key capabilities...
Alpine Chorus icon

Alpine Chorus

Alpine Chorus is an audio plugin for Mac and Windows designed specifically for creating vocal harmonies and choruses. Some of the key features include:Up to 24 harmony voices, with control over chord type, inversion, and spreadAutomatic pitch correction and formant/voice shifting for natural sounding harmony vocalsBuilt-in reverb, delay, modulation, and...
GoodData icon

GoodData

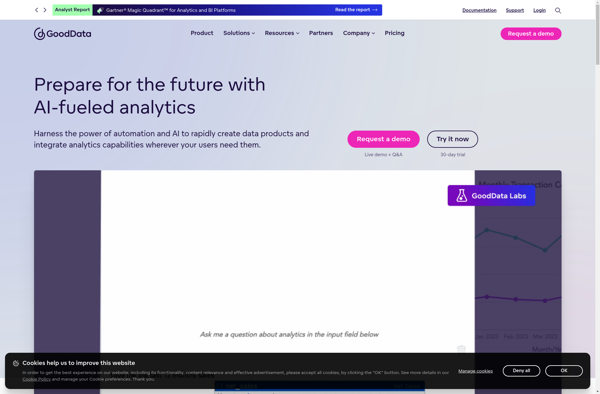
GoodData is a business intelligence and analytics platform used by companies to collect, store, and analyze their data to drive business decisions. Some key capabilities and features of GoodData include:Data warehousing and ETL - GoodData ingests data from various sources, transforms it, and loads it into a cloud data warehouse...
GoodData image
SharpDevelop Reports icon

SharpDevelop Reports

SharpDevelop Reports is an open source report designer and generation tool for .NET applications. It provides a visual report builder that allows developers to easily create rich, customizable reports including charts, images, tables, and more without writing code.Some key features of SharpDevelop Reports:Drag and drop report designer for building reports...
SharpDevelop Reports image
Prognoz icon

Prognoz

Prognoz is a comprehensive business forecasting and predictive analytics platform designed to help organizations improve forecast accuracy and operational efficiency. It leverages sophisticated artificial intelligence algorithms, time series analysis, simulation modeling, and machine learning techniques to uncover patterns in historical data and generate accurate demand forecasts.Key features of Prognoz include:Intuitive...
Centius Qi icon

Centius Qi

Centius Qi is an intuitive, code-free business automation platform powered by artificial intelligence. It helps companies eliminate manual processes, automate repetitive tasks, and streamline workflows across the organization.With an easy-to-use drag and drop interface, Centius allows anyone to build workflows, set up integrations, create intelligent chatbots, gather actionable insights from...
Logi Vision icon

Logi Vision

Logi Vision is a beginner-friendly video editing software for Windows and Mac. It provides an easy-to-use timeline interface to edit your video clips, add transitions between clips, apply titles and effects, adjust color, edit audio, and export your finished videos.Some key features of Logi Vision include:Intuitive drag-and-drop timeline editing interface...
Logi Vision image
Sybase IQ icon

Sybase IQ

Sybase IQ is an analytical database management system optimized for data warehousing, analytics, and business intelligence. It utilizes a column-oriented storage model designed to provide higher performance for analytic queries while using lower storage space compared to row-oriented databases.Key features and capabilities of Sybase IQ include:Column-oriented storage and vectorized query...
Diyotta 4.0 icon

Diyotta 4.0

Diyotta 4.0 is an open-source data integration and ETL (Extract, Transform, Load) platform optimized for big data use cases. It provides a scalable, flexible, and resilient data pipeline to move and transform data between various sources like databases, object stores, message queues, REST APIs, files, etc. and destinations like databases,...
Diyotta 4.0 image
ProClarity icon

ProClarity

ProClarity is a business intelligence and analytics software designed to help organizations make data-driven decisions. It provides an interactive dashboard and data visualization capabilities to easily analyze large datasets from multiple sources.Key features of ProClarity include:Drag-and-drop interface to quickly build dashboards and visualizationsBroad connectivity to import data from SQL Server,...
ProClarity image
Nucleon BI Studio icon

Nucleon BI Studio

Nucleon BI Studio is a self-service business intelligence and analytics platform used by organizations to visualize, analyze, and share data insights. It provides an intuitive drag-and-drop interface that enables users without technical skills to easily build interactive dashboards, reports, and workflows to gain actionable insights from their data.Key capabilities and...
Nucleon BI Studio image
KPI watchdog icon

KPI watchdog

KPI Watchdog is a robust business intelligence and data analytics platform designed to help companies track, analyze, and visualize key performance indicators (KPIs) in real-time. It provides powerful, customizable dashboards and reporting tools to monitor essential metrics across all departments and roles.With KPI Watchdog, businesses can connect data from multiple...
Palo Suite icon

Palo Suite

Palo Alto Networks' Palo Suite is an integrated platform that delivers a broad range of cybersecurity capabilities for enterprises. It brings together network security, cloud security, advanced threat prevention, and more into a single offering.At the core of Palo Suite is the company's next-generation firewalls, which provide granular visibility and...
Palo Suite image