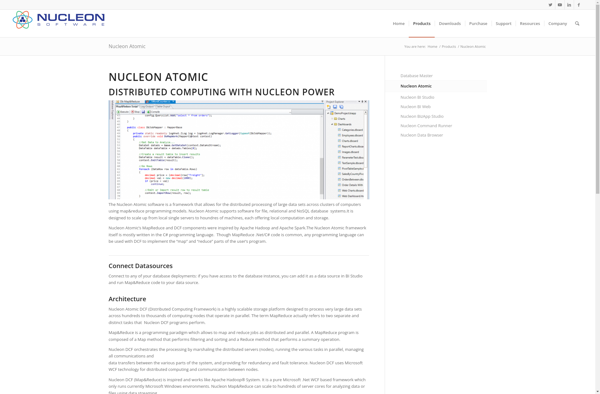
Nucleon BI Studio is a business intelligence and analytics platform that allows users to visualize, analyze, and share data insights. It has drag-and-drop functionality to build dashboards, reports, and workflows without coding.
Nucleon BI Studio: Business Intelligence & Analytics Platforms
A business intelligence and analytics platform with drag-and-drop functionality for building dashboards, reports, and workflows
What is Nucleon BI Studio?
Nucleon BI Studio is a self-service business intelligence and analytics platform used by organizations to visualize, analyze, and share data insights. It provides an intuitive drag-and-drop interface that enables users without technical skills to easily build interactive dashboards, reports, and workflows to gain actionable insights from their data.
Key capabilities and benefits of Nucleon BI Studio include:
Interactive dashboards with advanced visualizations like charts, graphs, gauges, maps, and more to monitor KPIs.
Ad-hoc reporting for business users to analyze data and share insights without IT help.
Data blending from multiple sources, including databases, cloud apps, files, etc.
Predictive analytics with machine learning to detect patterns and trends in data.
Collaboration features to discuss insights and annotate reports.
Scheduling and distribution to automatically deliver reports via email and portals.
Access control to manage user access and permissions.
APIs and integrations with DBs, apps, portals for extensibility.
Template apps and content packs to accelerate adoption.
With its user-friendly and self-service oriented approach, Nucleon BI Studio makes it easier for organizations to leverage analytics and enables data-driven decision making at scale.
Nucleon BI Studio Features
Features
Drag-and-drop interface to build dashboards, reports and workflows
Data visualization with charts, graphs and maps
Real-time analytics and alerting
Data modeling, ETL and data preparation
Collaboration tools to share insights
Integration with databases, cloud apps and other data sources
Pricing
Free
Freemium
Subscription-Based
Pros
Intuitive and easy to use
Powerful analytics and visualization capabilities
Scalable to large data volumes
Flexible pricing options
Good customer support
Cons
Steep learning curve for advanced features
Limited customization compared to open-source BI tools
Requires technical resources for complex data integration
IBM SPSS Statistics is a comprehensive software platform for statistical analysis in business, science, and social science research. First released in 1968, SPSS Statistics helps users apply complex statistical analyses and predictive analytics to unlock impactful insights from data.Key features and capabilities of SPSS Statistics include:Descriptive statistics like means, standard...
RStudio is a popular open-source IDE for R, a programming language for statistical computing and graphics. It provides a user-friendly graphical user interface that makes working with R much easier by integrating tools for plotting, debugging, workspace management, and other features.Some key features of RStudio include:Code editor with syntax highlighting,...
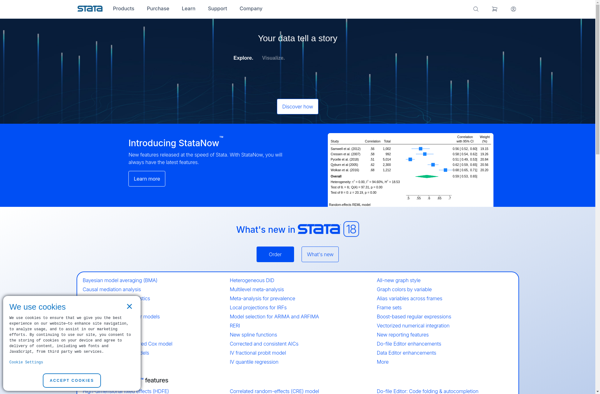
Stata is statistical software that is widely used by researchers in economics, political science, biomedicine, sociology, and other fields that require advanced statistical analysis and data visualization capabilities. It was first launched in 1985 by StataCorp and has since become one of the most popular statistical packages in academic research.Some...
Pentaho is a comprehensive open source business intelligence (BI) suite that provides a range of data integration, analytics, visualization, reporting, data mining, and workflow capabilities. It is designed to help businesses consolidate data from disparate sources for unified analytics and reporting.Some of the key capabilities and components of Pentaho include:Data...
Sisense is a business intelligence and data analytics software platform designed to help non-technical users prepare, analyze and visualize complex data. Some key features of Sisense include:Intuitive drag-and-drop interface for building interactive dashboards and visualizations like charts, graphs and pivot tables without coding.Ability to connect to wide variety of data...
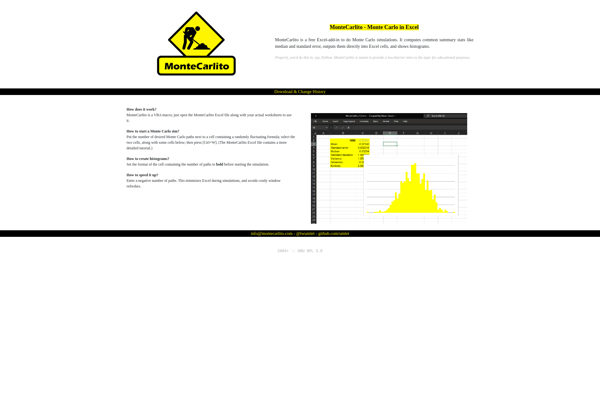
Montecarlito is an open-source typeface inspired by Times New Roman. It was created in 2018 by typographers Cadson Demak and Jacques Le Bailly to provide an alternative typeface that avoids the licensing restrictions of Times New Roman.Montecarlito has the same metrics as Times New Roman so it can be used...
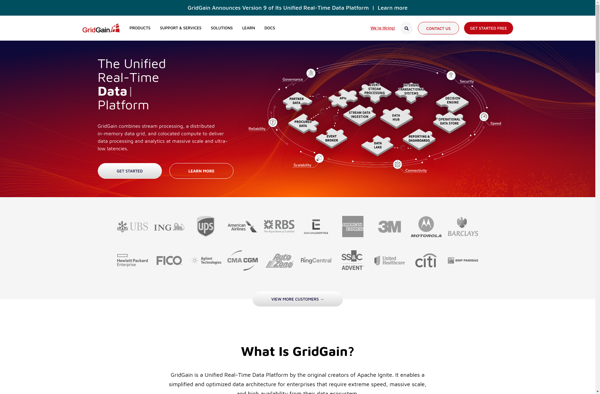
GridGain In-Memory Data Fabric is a distributed in-memory computing platform that enables organizations to develop data-intensive applications that require high performance and massive scalability. It provides an in-memory data grid that can be accessed by applications, allowing them to store and process data with in-memory speeds.Some key capabilities and benefits...
Oracle OLAP is an online analytical processing (OLAP) technology developed by Oracle Corporation as part of the Oracle Database. It allows users to analyze data across multiple dimensions with complex hierarchies and calculations at very fast speeds.Some key features of Oracle OLAP include:Multidimensional data model to capture business metrics and...
PAST is a comprehensive, user-friendly software package for scientific data analysis, with a focus on paleontology and paleobiology research. Developed by researchers at the University of Oslo, PAST provides a wide range of analytical tools and statistical tests within an intuitive graphical user interface.Key features of PAST include:Data manipulation -...
KiniMetrix is a cloud-based software platform designed for healthcare providers to help them better manage their practices, engage with patients, gain population health insights, and handle administrative tasks. It combines features typically found in separate electronic health record (EHR), practice management, patient portal and business intelligence solutions into one unified...
Statwing is a cloud-based statistical analysis and reporting software designed for ease of use by non-technical people. It provides an intuitive drag-and-drop interface that allows users to quickly conduct statistical tests, make customizable graphs and charts, and generate reports without coding.Some key features of Statwing include:Conduct common statistical tests like...
ProClarity is a business intelligence and analytics software designed to help organizations make data-driven decisions. It provides an interactive dashboard and data visualization capabilities to easily analyze large datasets from multiple sources.Key features of ProClarity include:Drag-and-drop interface to quickly build dashboards and visualizationsBroad connectivity to import data from SQL Server,...