PAST - PAlaeontological STatistics
PAST - PAlaeontological STatistics

PAST is a free, open-source software package for scientific data analysis, with specific tools for paleontologists. It includes functions for data manipulation, plotting, univariate and multivariate statistics, ecological analysis, time series analysis, trait analysis, and more.
PAST - PAlaeontological STatistics image
paleontology statistics data-analysis ecology time-series-analysis

PAST: Paleontological Statistics

A free, open-source software package for scientific data analysis, with specific tools for paleontologists, including data manipulation, plotting, statistics, ecological analysis, time series analysis, trait analysis and more.

What is PAST - PAlaeontological STatistics?

PAST is a comprehensive, user-friendly software package for scientific data analysis, with a focus on paleontology and paleobiology research. Developed by researchers at the University of Oslo, PAST provides a wide range of analytical tools and statistical tests within an intuitive graphical user interface.

Key features of PAST include:

  • Data manipulation - Import, export, transform, sort, subsample, and manage paleontological and ecological datasets
  • Exploratory data analysis - Summary statistics, histograms, boxplots, scatterplots, principal component analysis (PCA)
  • Univariate statistical tests - t-tests, ANOVA, correlation, regression, non-parametric tests
  • Multivariate statistics - PCA, detrended correspondence analysis, cluster analysis, discriminant analysis
  • Diversity and abundance analysis - Species diversity indices, rarefaction, rank abundance plots
  • Paleoecological analysis - Stratigraphic seriation, diversity partitioning
  • Time series analysis - Spectral analysis, wavelet analysis, modeling
  • Trait analysis - Measurement and analysis of biological traits
  • Plotting and visualization - Publication-quality 2D and 3D graphical output
  • Free and open-source - Actively developed by paleontologists

With an emphasis on ease-of-use and high-quality graphics, PAST enables researchers and students to thoroughly analyze, visualize, and interpret paleontological datasets. The availability of advanced multivariate tools in an accessible package makes PAST invaluable software for the paleobiology community.

PAST - PAlaeontological STatistics Features

Features

  1. Statistical analysis of paleontological data
  2. Data manipulation and transformation
  3. Univariate and multivariate statistics
  4. Ecological analysis
  5. Time series analysis
  6. Phylogenetic comparative methods
  7. Geometric morphometrics
  8. Plotting and graphing

Pricing

  • Free

Pros

Free and open source

User-friendly graphical interface

Wide range of analytical tools

Active development and user community

Runs on Windows, Mac, and Linux

Cons

Steep learning curve for advanced features

Limited documentation and support

Narrow focus on paleontological data


The Best PAST - PAlaeontological STatistics Alternatives

Top Science & Education and Paleontology and other similar apps like PAST - PAlaeontological STatistics


LIMDEP icon
LIMDEP

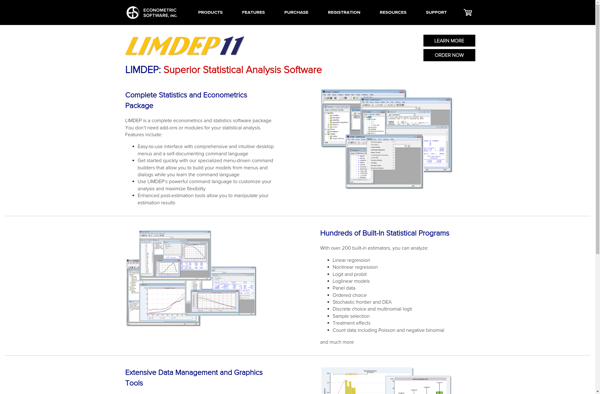
LIMDEP (Limited Dependent Variable Modeling) is proprietary econometrics software developed and sold by Econometric Software, Inc. It is used by economists, statisticians, analysts, and other researchers for economic modeling, forecasting, data analysis, and policy evaluation.Some key features of LIMDEP include:Tools for estimating a wide variety of econometric models including regression...
LIMDEP image
Gretl icon

Gretl

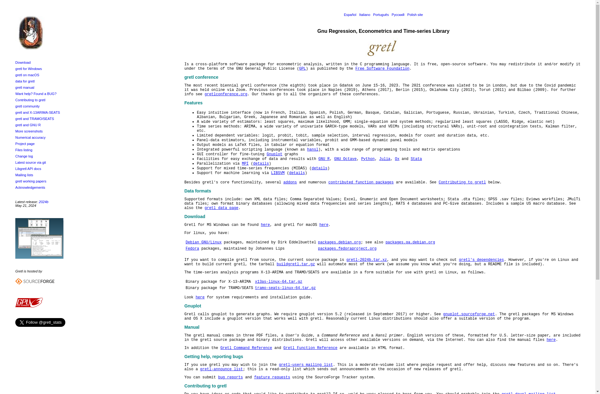
gretl is an open-source software package for econometric analysis. It supports a wide range of statistical techniques relevant to econometrics, such as cross-section, panel data, time series, nonparametric estimators, maximum likelihood, and general nonlinear least squares.Some key features of gretl include:User-friendly graphical interface for data entry, analysis, and visualizationScripting functionality...
Gretl image
OpenStat icon

OpenStat

OpenStat is an open-source, cross-platform software application for advanced statistical analysis, predictive modeling, and interactive data visualization. It provides a comprehensive set of statistical methods and machine learning algorithms with a graphical user interface that makes it easy for users of all backgrounds and skill levels to analyze data, identify...
Chemoface icon

Chemoface

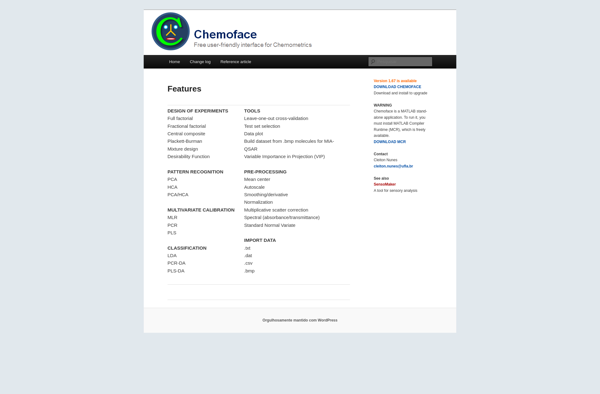
Chemoface is an open-source computer program for predicting the biological activities of chemical compounds. It utilizes machine learning models that have been trained on large datasets of chemicals and their associated bioassay data to predict potential therapeutic effects and safety risks.The key capabilities of Chemoface include:Predicting activity against a range...
Chemoface image
Mplus icon

Mplus

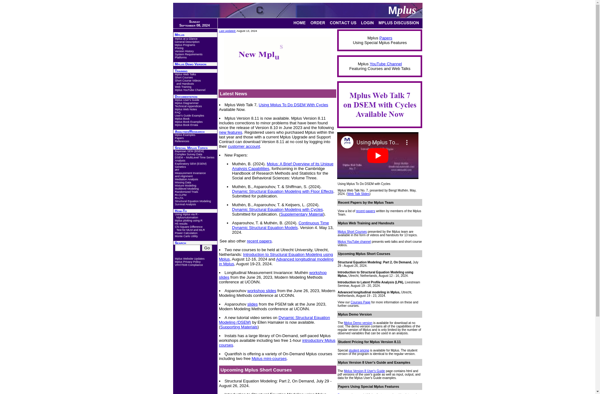
Mplus is a versatile and powerful software package for advanced quantitative data analysis. It specializes in structural equation modeling, multilevel modeling, growth modeling, mixture modeling, and other advanced modeling techniques used across the social, behavioral, and health sciences.Some key features and capabilities of Mplus include:Fitting complex theoretical models to empirical...
Mplus image
Develve icon

Develve

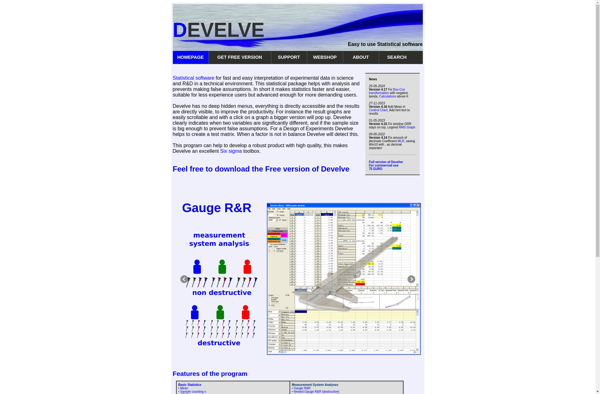
Develve is a flexible project management and bug tracking tool designed for agile software development teams. It provides a variety of features to plan, organize and track development projects, enabling seamless collaboration between team members.With Develve, you can:Manage user stories and tasks using kanban boardsTrack bugs and issues throughout the...
Develve image
Sigma Magic icon

Sigma Magic

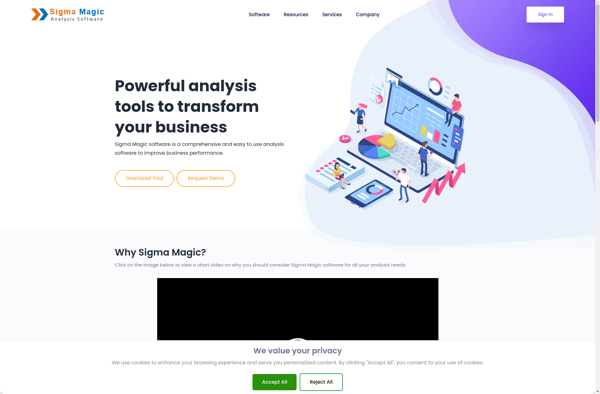
Sigma Magic is a user-friendly photo editing application designed specifically for portrait touch-ups and enhancements. Using advanced AI technology, Sigma Magic can automatically detect faces in photos and apply customizable one-click fixes to improve various facial attributes.Some of the standout features of Sigma Magic include:Blemish Remover - Instantly remove acne,...
Sigma Magic image
Six Sigma Calculator icon

Six Sigma Calculator

The Six Sigma Calculator is a free online tool designed to help quality professionals, students, and others perform common statistical calculations used in Six Sigma and quality improvement projects. With an easy-to-use interface, it includes the following key features and functions:Process Capability Analysis - Calculate Cp, Cpk, Pp, Ppk, and...
Six Sigma Calculator image
Revolution R icon

Revolution R

Revolution Analytics' Revolution R is a software environment and suite of tools designed to provide an enhanced user experience for the R programming language. Some key features of Revolution R include:Integrated Development Environment (IDE) - Provides an interface for authoring, debugging, and executing R code, with features like syntax highlighting,...
Revolution R image
StatsDirect icon

StatsDirect

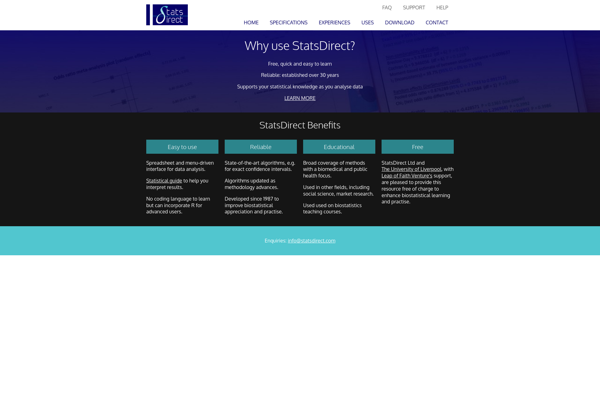
StatsDirect is a powerful and flexible statistical software package used for sophisticated data analysis, statistics, graphics, and reporting across various industries and applications. It provides a wide range of analytical methods, data visualization tools, and options for data input and output to meet diverse analytical needs.Key features of StatsDirect include:Extensive...
StatsDirect image
Nucleon BI Studio icon

Nucleon BI Studio

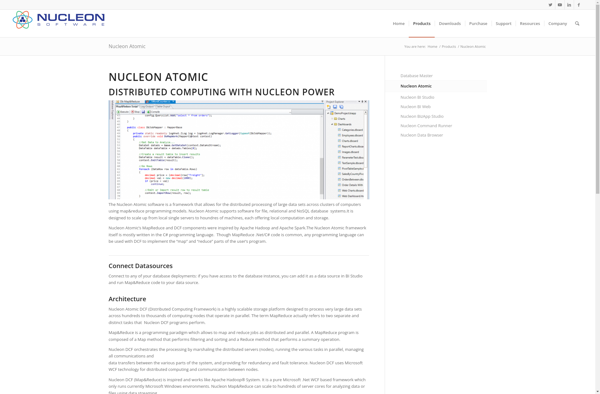
Nucleon BI Studio is a self-service business intelligence and analytics platform used by organizations to visualize, analyze, and share data insights. It provides an intuitive drag-and-drop interface that enables users without technical skills to easily build interactive dashboards, reports, and workflows to gain actionable insights from their data.Key capabilities and...
Nucleon BI Studio image
Variables icon

Variables

Variables is a user research and insights platform designed to help agile product teams validate ideas and make better product decisions. It provides an end-to-end solution to plan research, create flexible surveys, recruit participants from a global panel, analyze responses, and share insights.Key features include:Flexible survey builder with logic, images,...