OpenStat is an open-source platform for statistical analysis and data visualization. It offers a user-friendly graphical interface for exploring data, building statistical models, creating customizable charts and graphs, and generating reports.
OpenStat: Open-Source Statistical Analysis and Data Visualization Platform
OpenStat is an open-source platform for statistical analysis and data visualization. It offers a user-friendly graphical interface for exploring data, building statistical models, creating customizable charts and graphs, and generating reports.
What is OpenStat?
OpenStat is an open-source, cross-platform software application for advanced statistical analysis, predictive modeling, and interactive data visualization. It provides a comprehensive set of statistical methods and machine learning algorithms with a graphical user interface that makes it easy for users of all backgrounds and skill levels to analyze data, identify trends and patterns, build models, and generate insights.
Some key features of OpenStat include:
Importing and combining data from CSV, Excel, databases, and other sources
Data manipulation tools like filtering, transformations, merging, cleaning, and more
Descriptive data analysis and statistics functions like summaries, frequencies, cross-tabs, etc.
Statistical modeling (linear regression, ANOVA, PCA), machine learning (classification, clustering), and time series forecasting
Interactive data visualization with publication-quality charts, graphs, and maps
Customizable reports and dashboards for results sharing
Collaborative workspaces for teams to analyze data together
OpenStat runs on Windows, macOS, and Linux. It provides a familiar spreadsheet-style data sheet along with point-and-click menus for accessing its broad analysis toolset easily. With full documentation and a large user community, OpenStat makes advanced analytics accessible for experts and non-technical users alike across many industries and use cases.
OpenStat Features
Features
Data exploration and visualization
Statistical analysis
Model building
Customizable charts and graphs
Report generation
Pricing
Open Source
Pros
User-friendly graphical interface
Open-source and free
Wide range of statistical methods
Customizable and extensible
Cons
Limited data import options
Less support compared to paid options
Fewer advanced analytics features than proprietary software
IBM SPSS Statistics is a comprehensive software platform for statistical analysis in business, science, and social science research. First released in 1968, SPSS Statistics helps users apply complex statistical analyses and predictive analytics to unlock impactful insights from data.Key features and capabilities of SPSS Statistics include:Descriptive statistics like means, standard...
Minitab is a comprehensive software package used for statistical analysis and quality improvement applications. It has a wide range of analytical capabilities including basic statistics, regression analysis, design of experiments, statistical process control charts, reliability analysis, and more.Some key features and benefits of Minitab:User-friendly spreadsheet-style interface for entering, viewing, and...
RStudio is a popular open-source IDE for R, a programming language for statistical computing and graphics. It provides a user-friendly graphical user interface that makes working with R much easier by integrating tools for plotting, debugging, workspace management, and other features.Some key features of RStudio include:Code editor with syntax highlighting,...
Deducer is a user-friendly open-source data analysis software aimed at beginners looking to learn statistics and data analysis using R without having to code. It was designed by academic researchers to be a free easy-to-use alternative to proprietary statistical software packages.Deducer provides a graphical user interface to R that allows...
PSPP is a free and open source alternative to the proprietary IBM SPSS Statistics software. It aims to provide similar capabilities and features for statistical analysis, data management, and graphics as SPSS Statistics does, while being available at no cost under the GNU General Public License.Some key features and capabilities...
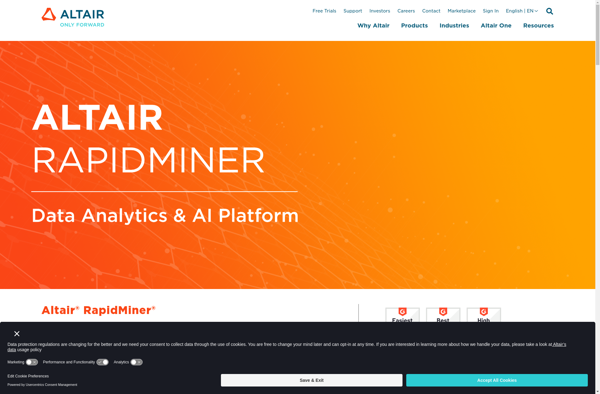
Altair RapidMiner is a comprehensive data science software platform used by organizations for data preparation, machine learning, deep learning, text mining, and predictive analytics. It provides a visual, drag-and-drop interface to quickly build, test, deploy, and manage advanced analytic workflows and machine learning models.Key capabilities include:Data preparation tools for cleaning,...
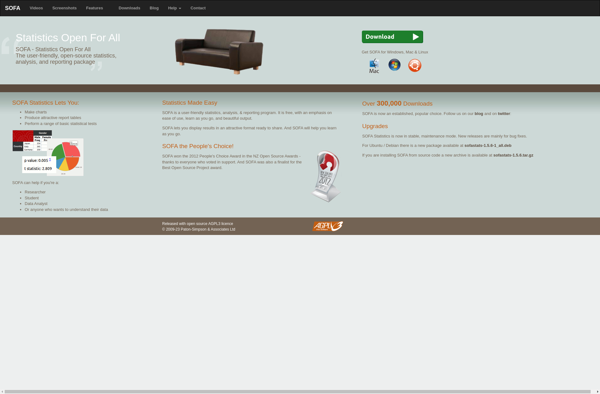
SOFA Statistics is a user-friendly, open-source statistics, analysis, and reporting tool that runs as a desktop application on Windows, Mac, and Linux. It provides an extensive range of statistical methods and visualization tools for exploratory data analysis, data cleaning, model fitting, results reporting, and dashboard creation.Some key features of SOFA...
The R Commander is a basic-statistics graphical user interface for R, an open source programming language and software environment for statistical analysis, data manipulation, and graphics visualization. The R Commander provides a simple way to utilize many R features through menus, dialog boxes, and other user interface controls rather than...
EasyTab is a free, open-source guitar tablature editor for Windows. It aims to provide an intuitive interface for creating, editing, printing and listening to tablature files for guitar and other fretted instruments.Some of the key features of EasyTab include:Simple, straightforward interface for entering and editing tablatureMIDI playback to hear how...
PAST is a comprehensive, user-friendly software package for scientific data analysis, with a focus on paleontology and paleobiology research. Developed by researchers at the University of Oslo, PAST provides a wide range of analytical tools and statistical tests within an intuitive graphical user interface.Key features of PAST include:Data manipulation -...
Terrene is an innovative design collaboration platform built for modern product teams to simplify the complex design and development workflow. It allows teams to easily create, view, share, and collaborate on photorealistic 3D models from any device from any location.Some key features and benefits of Terrene include:Intuitive creation - Anyone...