Deducer is an open-source data analysis GUI for R aimed at beginners looking to learn statistics. It has a user-friendly interface that allows novices to easily access R's extensive graphical and statistical capabilities without coding.
Deducer: Open-Source Data Analysis GUI for R Beginners
An open-source data analysis software with a user-friendly interface, ideal for beginners learning statistics and accessing R's extensive graphical and statistical capabilities without coding.
What is Deducer?
Deducer is a user-friendly open-source data analysis software aimed at beginners looking to learn statistics and data analysis using R without having to code. It was designed by academic researchers to be a free easy-to-use alternative to proprietary statistical software packages.
Deducer provides a graphical user interface to R that allows users to import, visualize, transform, model and analyze datasets without programming knowledge. It supports the entire data analysis pipeline - from data cleaning, to exploration, to modeling. Users can visualize data through charts, plots, and tables generated automatically from R models and functions without manually typing any commands.
Some key features of Deducer include:
An intuitive point-and-click menu system to access over 200 R data analysis tools and tests
Automated R code and visualization generation
Data filtering, transformation and modeling capabilities
Interactive charts linked statistically to data tables
Data importing from common file types like CSV, Stata, SPSS
Capability to export analysis results
Plot builder to visualize data
Menu of statistical learning techniques like regression, PCA, clustering
With its user-friendly interface masking R's programming complexity, Deducer makes quantitative data analysis accessible to anyone interested in statistics. It is a great free alternative for non-programmers looking to utilize R's capabilities for data science, machine learning and visualization.
Deducer Features
Features
User-friendly graphical user interface for R
Menu-driven interface to generate R code
Data viewer to explore and visualize data
Model fitting dialogs for common statistical models
Output viewer to display graphs, tables, summaries
R is an open-source programming language and free software environment for statistical computing, bioinformatics, graphics, data science, and general-purpose programming. The R language provides a wide variety of statistical analysis techniques and graphical capabilities which make it a popular choice for data analysis and visualization.Some key features of R include:Open-source...
IBM SPSS Statistics is a comprehensive software platform for statistical analysis in business, science, and social science research. First released in 1968, SPSS Statistics helps users apply complex statistical analyses and predictive analytics to unlock impactful insights from data.Key features and capabilities of SPSS Statistics include:Descriptive statistics like means, standard...
Minitab is a comprehensive software package used for statistical analysis and quality improvement applications. It has a wide range of analytical capabilities including basic statistics, regression analysis, design of experiments, statistical process control charts, reliability analysis, and more.Some key features and benefits of Minitab:User-friendly spreadsheet-style interface for entering, viewing, and...
RStudio is a popular open-source IDE for R, a programming language for statistical computing and graphics. It provides a user-friendly graphical user interface that makes working with R much easier by integrating tools for plotting, debugging, workspace management, and other features.Some key features of RStudio include:Code editor with syntax highlighting,...
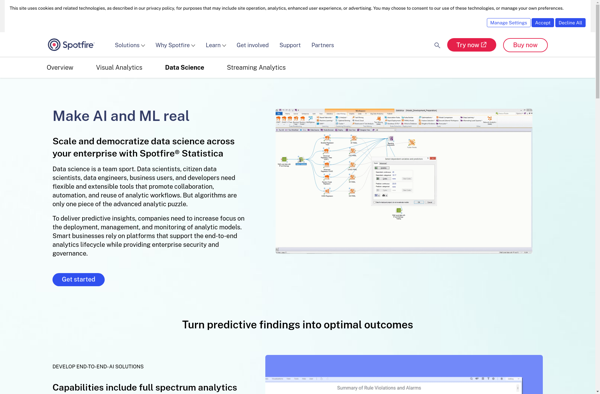
STATISTICA is a powerful and comprehensive data analysis software suite that has been developed over 30+ years by StatSoft. It provides analytics capabilities for a wide range of industries and applications.Key features of STATISTICA include:Advanced data visualization with interactive dashboards, graphs and chartsPredictive analytics and data mining algorithms like regression,...
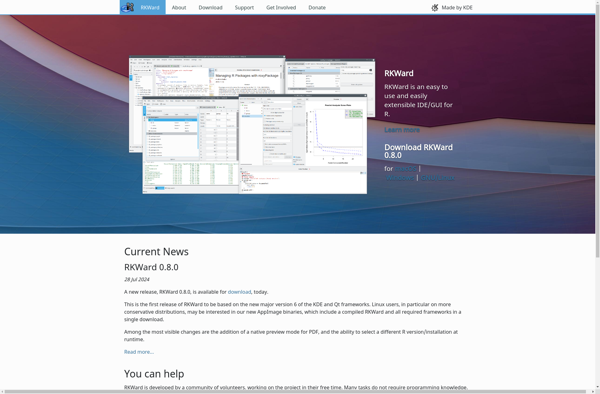
RKWard is a free and open-source integrated development environment for the R statistical programming language. It provides a graphical user interface that allows users to work with R without needing to manually type code.Some key features of RKWard include:Code editor with syntax highlighting, auto-completion and other productivity toolsData viewer to...
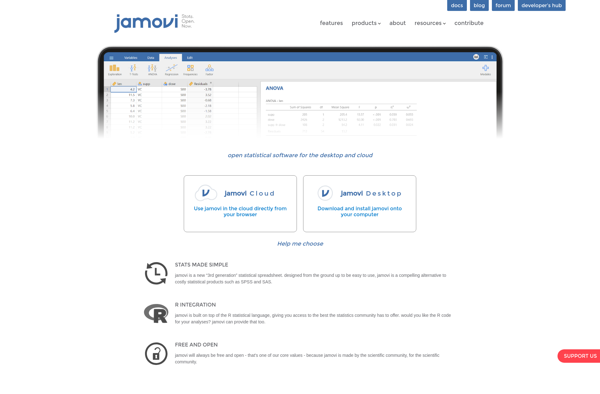
jamovi is an open-source and free statistical software that provides a user-friendly graphical user interface for conducting statistical analyses. It aims to make advanced analytics more accessible to students, researchers, and business users without requiring them to learn a programming language.Some key features of jamovi include:An intuitive and clean graphical...
PSPP is a free and open source alternative to the proprietary IBM SPSS Statistics software. It aims to provide similar capabilities and features for statistical analysis, data management, and graphics as SPSS Statistics does, while being available at no cost under the GNU General Public License.Some key features and capabilities...
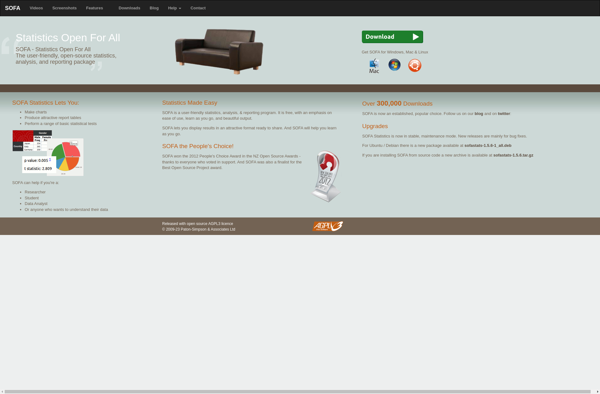
SOFA Statistics is a user-friendly, open-source statistics, analysis, and reporting tool that runs as a desktop application on Windows, Mac, and Linux. It provides an extensive range of statistical methods and visualization tools for exploratory data analysis, data cleaning, model fitting, results reporting, and dashboard creation.Some key features of SOFA...
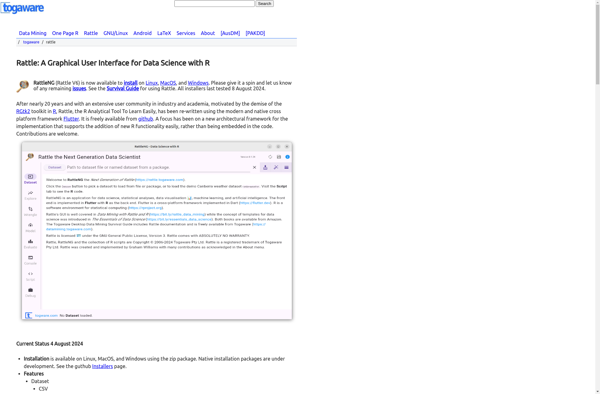
Rattle (the R Analytical Tool To Learn Easily) is an open-source graphical user interface for data mining that runs on the R statistical programming language. It allows users to visually create, evaluate, and refine data mining models without programming.Some key features of Rattle include:Interactive graphical interface for building workflows and...
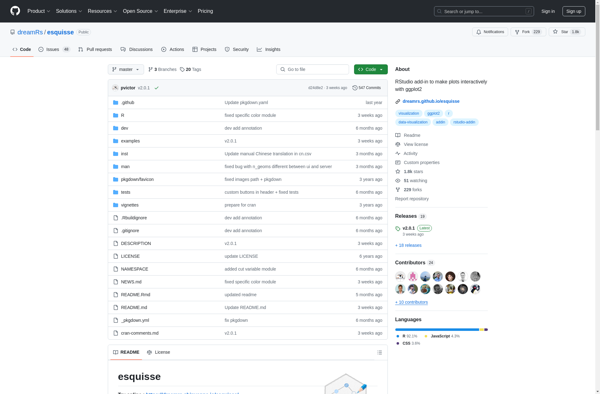
Esquisse is a free and open source painting and drawing application designed for the Linux operating system. It provides a simple but powerful set of tools for creating digital artwork from scratch.Some key features of Esquisse include:Intuitive user interface with a focus on ease of useSupport for multiple canvas sizes...
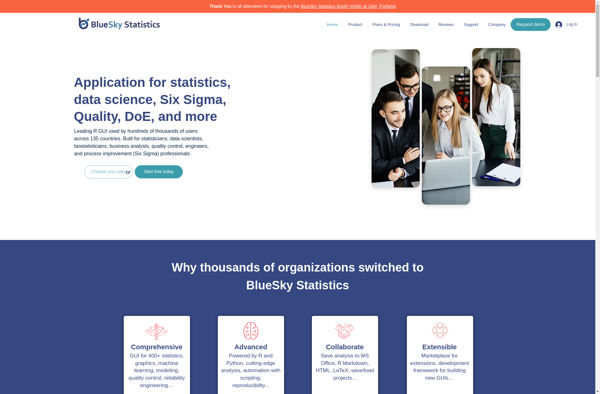
BlueSky Statistics is an open-source software application designed specifically for performing advanced data analysis and statistical modeling. It features a user-friendly graphical interface that allows users to easily explore, visualize, transform, and model their data without needing to know programming or statistical syntax.Some key capabilities of BlueSky Statistics include:Intuitive drag-and-drop...
The R Commander is a basic-statistics graphical user interface for R, an open source programming language and software environment for statistical analysis, data manipulation, and graphics visualization. The R Commander provides a simple way to utilize many R features through menus, dialog boxes, and other user interface controls rather than...
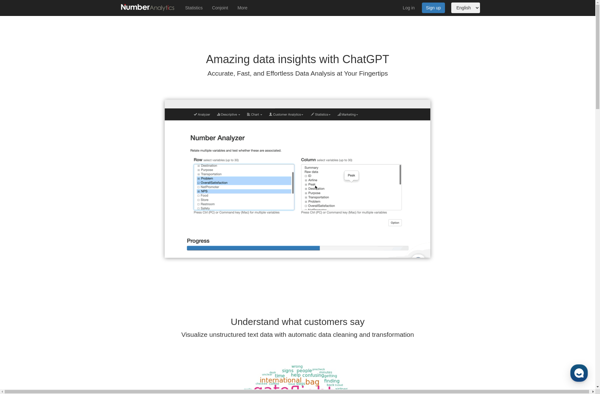
Number Analytics is a powerful data analytics and business intelligence platform designed specifically for working with numerical and quantitative data. It provides a wide range of features and capabilities for data preparation, statistical analysis, data visualization, and reporting.Some of the key capabilities of Number Analytics include:Data connectivity to import data...
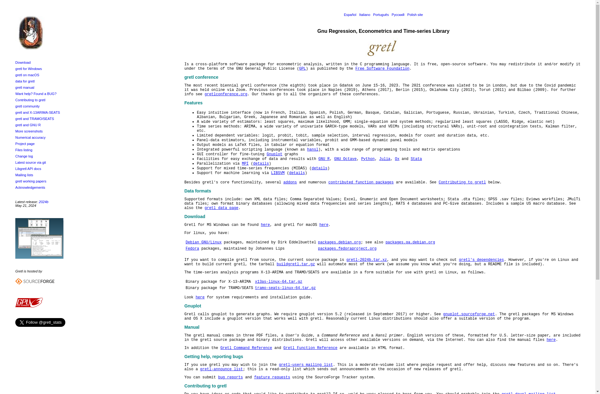
gretl is an open-source software package for econometric analysis. It supports a wide range of statistical techniques relevant to econometrics, such as cross-section, panel data, time series, nonparametric estimators, maximum likelihood, and general nonlinear least squares.Some key features of gretl include:User-friendly graphical interface for data entry, analysis, and visualizationScripting functionality...
OpenStat is an open-source, cross-platform software application for advanced statistical analysis, predictive modeling, and interactive data visualization. It provides a comprehensive set of statistical methods and machine learning algorithms with a graphical user interface that makes it easy for users of all backgrounds and skill levels to analyze data, identify...
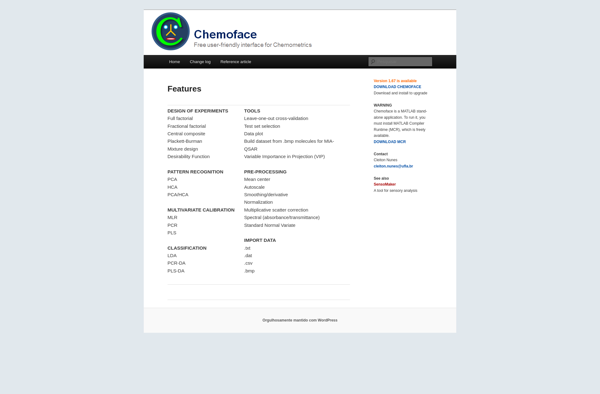
Chemoface is an open-source computer program for predicting the biological activities of chemical compounds. It utilizes machine learning models that have been trained on large datasets of chemicals and their associated bioassay data to predict potential therapeutic effects and safety risks.The key capabilities of Chemoface include:Predicting activity against a range...
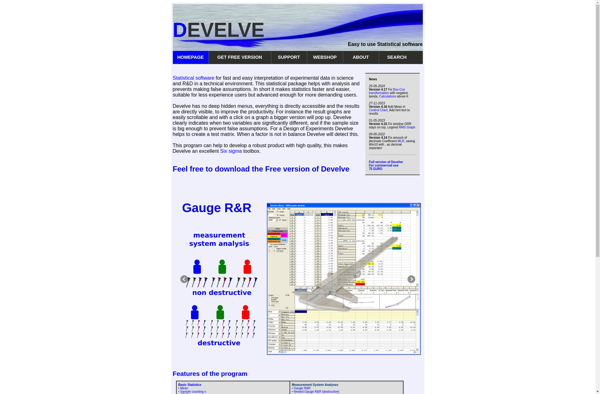
Develve is a flexible project management and bug tracking tool designed for agile software development teams. It provides a variety of features to plan, organize and track development projects, enabling seamless collaboration between team members.With Develve, you can:Manage user stories and tasks using kanban boardsTrack bugs and issues throughout the...
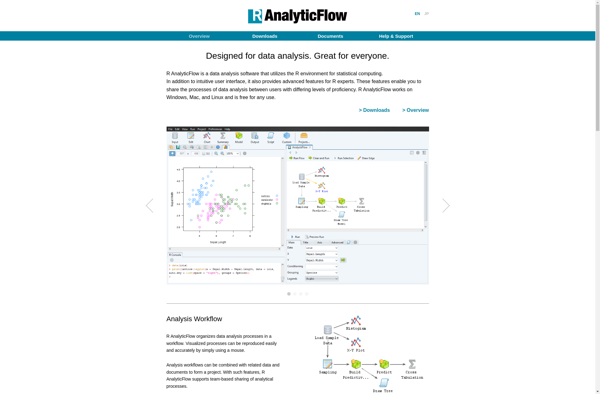
R AnalyticFlow is an open-source data analysis platform built specifically for the R programming language. It allows data scientists and analysts to create reusable analysis flows that connect various data sources, R scripts, and visualization code together into an end-to-end pipeline.Some key features of R AnalyticFlow include:Visual workflow editor -...
ggraptR is an R package that builds on ggplot2 to create specialized graphs for network analysis, geospatial data, and text analysis. It provides a grammar of graphics interface, making complex multivariate data visualization more accessible. Key features include:Network visualization - plot network graphs and trees with automatic layouts like force-directed,...
WinBUGS is statistical software for Bayesian analysis using Markov chain Monte Carlo (MCMC) methods. It allows the user to specify complex statistical models, then generates simulations from the posterior distributions to make inferences about parameters of interest.Some key features of WinBUGS:Flexible specification of statistical models using BUGS model syntaxWide range...
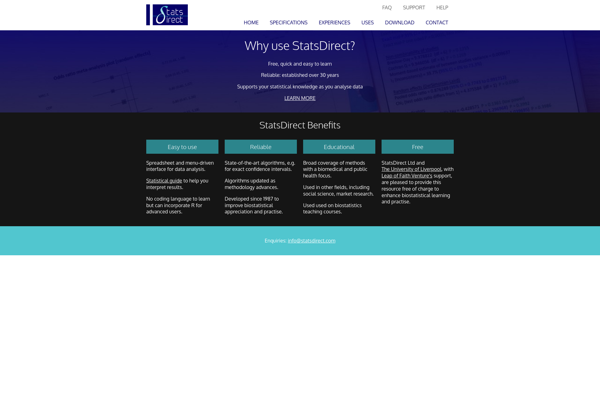
StatsDirect is a powerful and flexible statistical software package used for sophisticated data analysis, statistics, graphics, and reporting across various industries and applications. It provides a wide range of analytical methods, data visualization tools, and options for data input and output to meet diverse analytical needs.Key features of StatsDirect include:Extensive...
Variables is a user research and insights platform designed to help agile product teams validate ideas and make better product decisions. It provides an end-to-end solution to plan research, create flexible surveys, recruit participants from a global panel, analyze responses, and share insights.Key features include:Flexible survey builder with logic, images,...