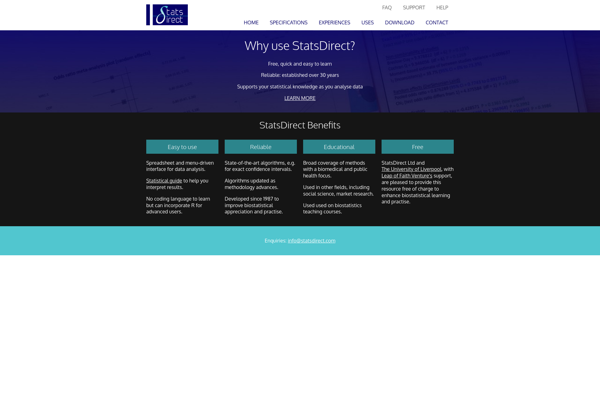
StatsDirect is statistical software used for data analysis, statistics, graphics, and reporting. It is designed for research scientists and data analysts across various industries like healthcare, government, education, manufacturing, and more.
StatsDirect: Statistical Software for Data Analysis
Statistical software used for data analysis, statistics, graphics, and reporting for research scientists and data analysts across various industries like healthcare, government, education, manufacturing, and more.
What is StatsDirect?
StatsDirect is a powerful and flexible statistical software package used for sophisticated data analysis, statistics, graphics, and reporting across various industries and applications. It provides a wide range of analytical methods, data visualization tools, and options for data input and output to meet diverse analytical needs.
Key features of StatsDirect include:
Extensive range of statistical analyses including descriptive statistics, estimation, hypothesis testing, regression, ANOVA, survival analysis, and more
In-depth graphics capabilities for data visualization including histograms, scatter plots, box plots, dot plots, maps, and specialized graphs
Customizable, publication-quality reporting
Analysis automation and batch processing
Import/export data from Excel, databases, and other sources
Can handle large complex datasets
Runs on Windows platforms
Used widely in healthcare, government, education, manufacturing, BFSI and other industries
Offers validation services for regulated environments like clinical trials or research
StatsDirect excels in both statistics and data visualization for knowledgeable data analysts. Its flexibility supports a wide variety of analytical use cases across domains and industries.
StatsDirect Features
Features
Statistical analysis
Graphics
Reporting
Data management
Automation
Integration with R and Python
Customizable interface
Pricing
Subscription-Based
Pros
User-friendly interface
Powerful statistical capabilities
Integration with R and Python
Automation and batch processing
Customizable graphs and reports
Can handle large datasets
Cons
Steep learning curve
Expensive
Limited support for some advanced statistical techniques
R is an open-source programming language and free software environment for statistical computing, bioinformatics, graphics, data science, and general-purpose programming. The R language provides a wide variety of statistical analysis techniques and graphical capabilities which make it a popular choice for data analysis and visualization.Some key features of R include:Open-source...
IBM SPSS Statistics is a comprehensive software platform for statistical analysis in business, science, and social science research. First released in 1968, SPSS Statistics helps users apply complex statistical analyses and predictive analytics to unlock impactful insights from data.Key features and capabilities of SPSS Statistics include:Descriptive statistics like means, standard...
Minitab is a comprehensive software package used for statistical analysis and quality improvement applications. It has a wide range of analytical capabilities including basic statistics, regression analysis, design of experiments, statistical process control charts, reliability analysis, and more.Some key features and benefits of Minitab:User-friendly spreadsheet-style interface for entering, viewing, and...
RStudio is a popular open-source IDE for R, a programming language for statistical computing and graphics. It provides a user-friendly graphical user interface that makes working with R much easier by integrating tools for plotting, debugging, workspace management, and other features.Some key features of RStudio include:Code editor with syntax highlighting,...
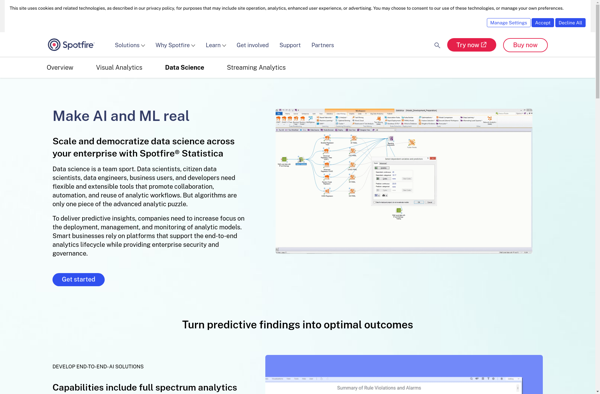
STATISTICA is a powerful and comprehensive data analysis software suite that has been developed over 30+ years by StatSoft. It provides analytics capabilities for a wide range of industries and applications.Key features of STATISTICA include:Advanced data visualization with interactive dashboards, graphs and chartsPredictive analytics and data mining algorithms like regression,...
Deducer is a user-friendly open-source data analysis software aimed at beginners looking to learn statistics and data analysis using R without having to code. It was designed by academic researchers to be a free easy-to-use alternative to proprietary statistical software packages.Deducer provides a graphical user interface to R that allows...
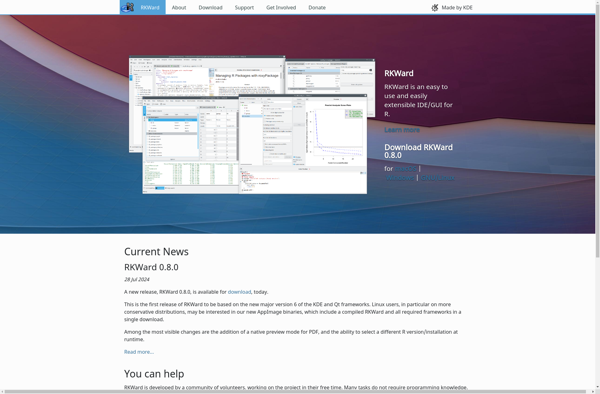
RKWard is a free and open-source integrated development environment for the R statistical programming language. It provides a graphical user interface that allows users to work with R without needing to manually type code.Some key features of RKWard include:Code editor with syntax highlighting, auto-completion and other productivity toolsData viewer to...
PSPP is a free and open source alternative to the proprietary IBM SPSS Statistics software. It aims to provide similar capabilities and features for statistical analysis, data management, and graphics as SPSS Statistics does, while being available at no cost under the GNU General Public License.Some key features and capabilities...
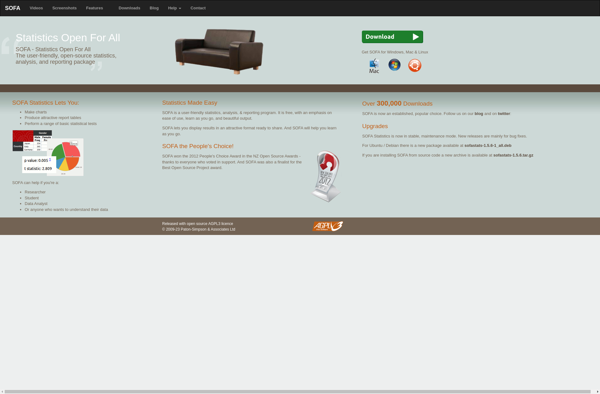
SOFA Statistics is a user-friendly, open-source statistics, analysis, and reporting tool that runs as a desktop application on Windows, Mac, and Linux. It provides an extensive range of statistical methods and visualization tools for exploratory data analysis, data cleaning, model fitting, results reporting, and dashboard creation.Some key features of SOFA...
The R Commander is a basic-statistics graphical user interface for R, an open source programming language and software environment for statistical analysis, data manipulation, and graphics visualization. The R Commander provides a simple way to utilize many R features through menus, dialog boxes, and other user interface controls rather than...
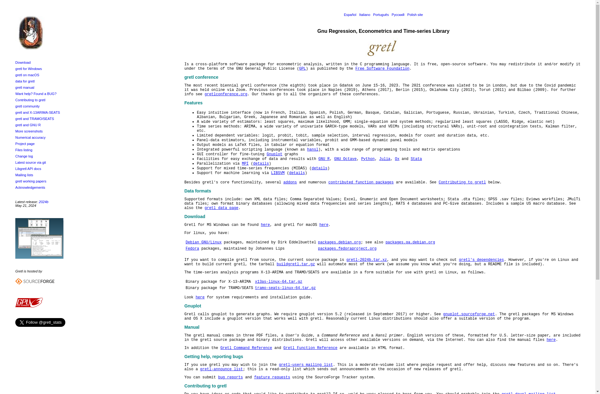
gretl is an open-source software package for econometric analysis. It supports a wide range of statistical techniques relevant to econometrics, such as cross-section, panel data, time series, nonparametric estimators, maximum likelihood, and general nonlinear least squares.Some key features of gretl include:User-friendly graphical interface for data entry, analysis, and visualizationScripting functionality...
PAST is a comprehensive, user-friendly software package for scientific data analysis, with a focus on paleontology and paleobiology research. Developed by researchers at the University of Oslo, PAST provides a wide range of analytical tools and statistical tests within an intuitive graphical user interface.Key features of PAST include:Data manipulation -...
WinBUGS is statistical software for Bayesian analysis using Markov chain Monte Carlo (MCMC) methods. It allows the user to specify complex statistical models, then generates simulations from the posterior distributions to make inferences about parameters of interest.Some key features of WinBUGS:Flexible specification of statistical models using BUGS model syntaxWide range...