STATISTICA
STATISTICA: Comprehensive Data Analysis Software
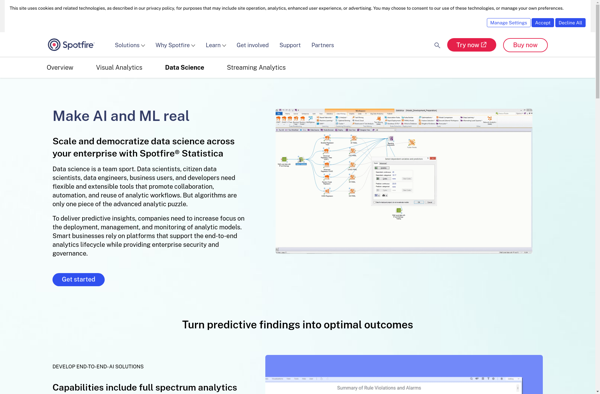
STATISTICA is a comprehensive data analysis software suite developed by StatSoft. It provides a wide range of analytics capabilities including data visualization, predictive modeling, data mining, forecasting, quality control charts, and more.
What is STATISTICA?
STATISTICA is a powerful and comprehensive data analysis software suite that has been developed over 30+ years by StatSoft. It provides analytics capabilities for a wide range of industries and applications.
Key features of STATISTICA include:
- Advanced data visualization with interactive dashboards, graphs and charts
- Predictive analytics and data mining algorithms like regression, decision trees, neural networks, clustering, etc.
- Time series analysis and forecasting models such as Exponential Smoothing, ARIMA, GARCH
- Quality control charts for statistical process control
- Text mining capabilities for analyzing unstructured text data
- An extensive model comparison and validation toolkit
- Automated report generation features
STATISTICA supports a variety of data sources including Excel, databases, CSV, JSON, SPSS, SAS, Matlab and more. It provides a workflow-based user interface to streamline advanced analytics processes. STATISTICA also offers deployment options to scale analytical models into production with scoring engines.
With its breadth of analytics capabilities and decades of development, STATISTICA is used widely in fields like banking, insurance, manufacturing, education, retail, healthcare and more. It can handle small to extremely large data volumes to power advanced analytics applications.
STATISTICA Features
Features
- Data visualization
- Predictive modeling
- Data mining
- Forecasting
- Quality control charts
Pricing
- Subscription-Based
Pros
Cons
Official Links
Reviews & Ratings
Login to ReviewThe Best STATISTICA Alternatives
View all STATISTICA alternatives with detailed comparison →
Top Ai Tools & Services and Data Analysis and other similar apps like STATISTICA
Here are some alternatives to STATISTICA:
Suggest an alternative ❐R (programming language)

IBM SPSS Statistics

Minitab

RStudio

Deducer

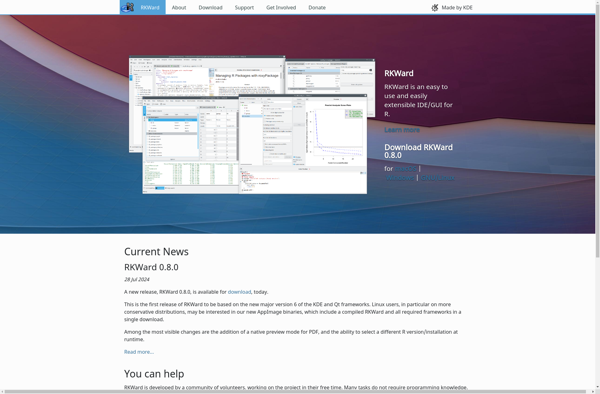
RKWard
PSPP

Displayr

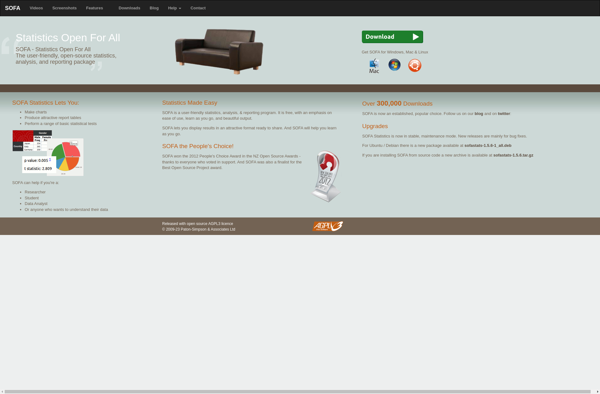
SOFA Statistics
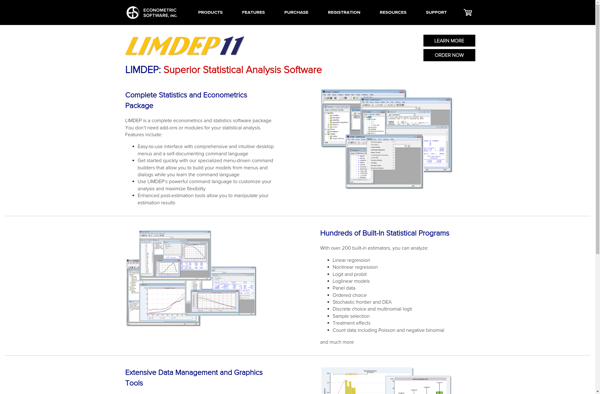
LIMDEP
The R Commander

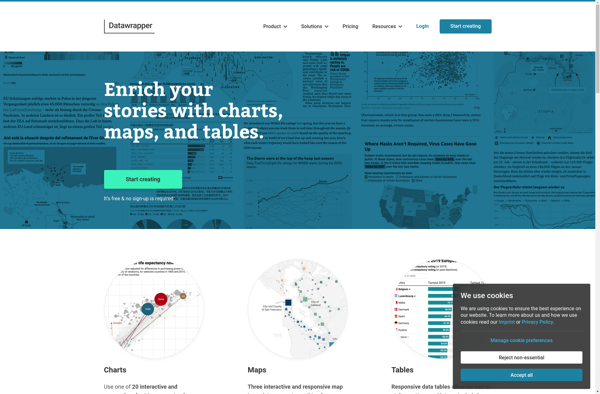
Datawrapper
Wizard Pro

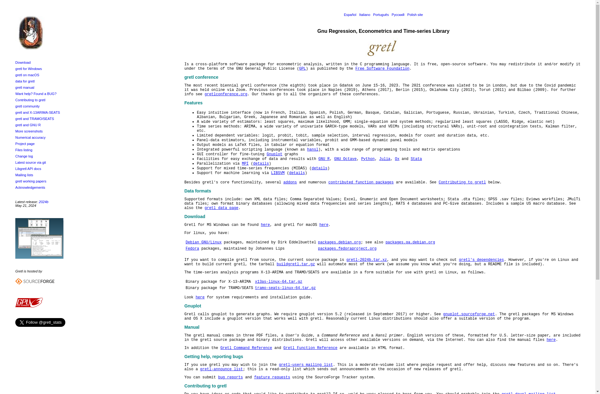
Gretl
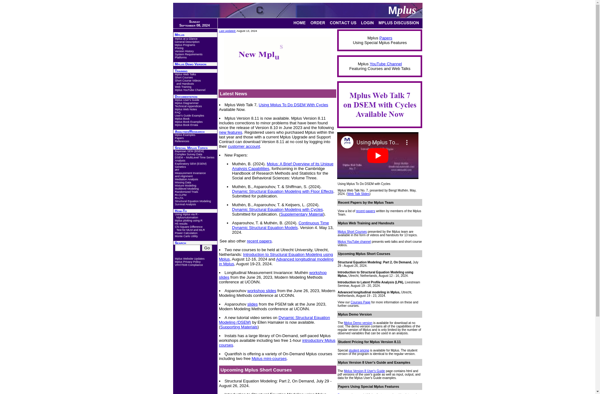
Mplus
Neural Designer

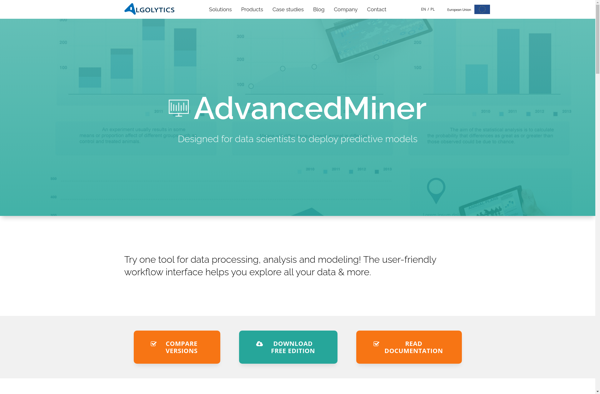
AdvancedMiner
Sigma Magic

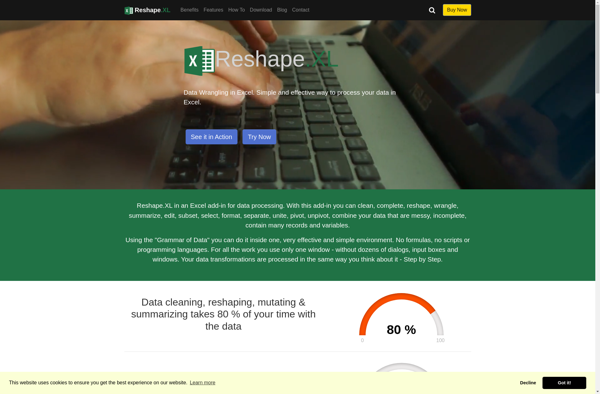
Reshape.XL
Easytab
Six Sigma Calculator

Revolution R

Q Research Software

WinBUGS
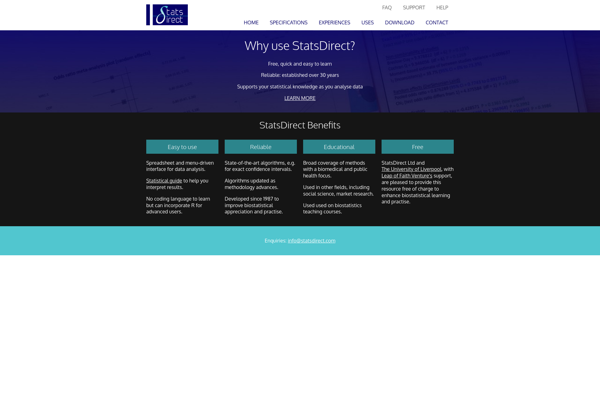
StatsDirect
Variables
SOSstat
