Datawrapper
Datawrapper: Easy Data Visualization
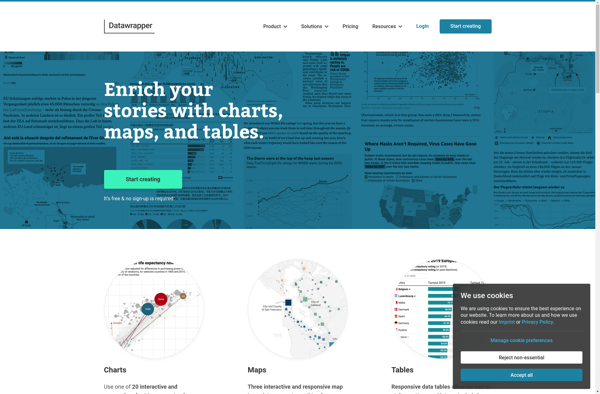
A simple drag-and-drop data visualization tool that allows anyone to create interactive charts, graphs, and maps without coding, ideal for sharing and visualizing data.
What is Datawrapper?
Datawrapper is a powerful yet user-friendly data visualization tool used by journalists, researchers, NGOs, and businesses to create interactive charts, graphs, and maps. Its drag-and-drop interface makes it easy for anyone to visualize data without needing to know how to code.
Some key features of Datawrapper include:
- Various chart types including bar charts, line charts, pie charts, scatter plots, bubble charts, and more
- Interactive maps with customizable regions, markers, and labels
- Auto-generated charts from spreadsheet data
- Style customization of colors, fonts, tooltip text, and other design elements
- Annotations and highlighting key data points
- Exporting charts in multiple formats like PNG, PDF, SVG, and iframe embeds
- Collaboration tools to edit visuals with a team
- Upload your own data or connect to Google Sheets, Dropbox, databases and other sources
- Host charts on Datawrapper's site or embed on your own site
With an easy learning curve and flexible pricing plans, Datawrapper makes data visualization accessible for organizations big and small. Its visualization gallery showcases examples of interactive charts created by users across various industries. For those looking for an intuitive way to present data visually both online and in reports, Datawrapper is worth exploring.
Datawrapper Features
Features
- Drag-and-drop interface for creating charts/graphs
- Supports various chart types like bar charts, line charts, pie charts, etc
- Customizable themes and color palettes
- Interactive charts with tooltips and annotations
- Ability to embed charts into websites/blogs
- Export charts as images or PDF files
- Create maps with customizable markers, labels, etc
- Collaboration features to share and edit charts together
- Upload CSV/Excel data to auto-generate visualizations
Pricing
- Freemium
Pros
Cons
Official Links
Reviews & Ratings
Login to ReviewThe Best Datawrapper Alternatives
View all Datawrapper alternatives with detailed comparison →
Top Office & Productivity and Data Visualization and other similar apps like Datawrapper
Here are some alternatives to Datawrapper:
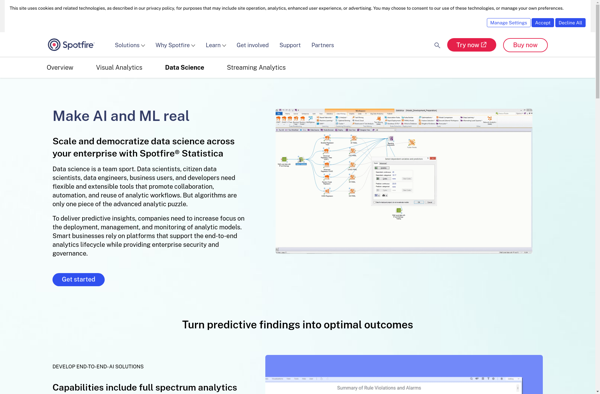
Suggest an alternative ❐STATISTICA
Ascend

SymPy

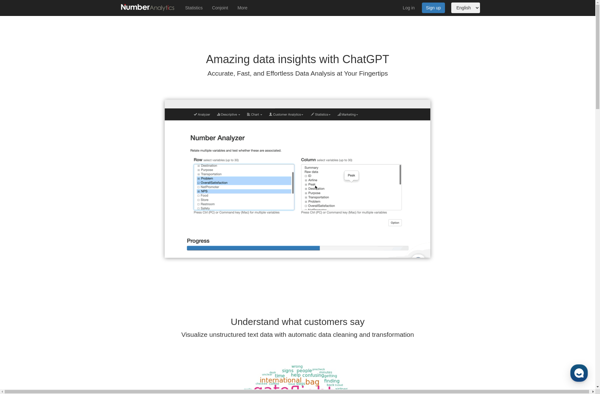
Number Analytics
Statwing

DataCracker