Ascend

Ascend

Ascend is a data analytics and data management platform designed to help companies organize, analyze, and visualize their data. It provides tools for data preparation, reporting, and predictive analytics.
Ascend image
data-management data-analytics data-visualization reporting predictive-analytics

Ascend: Data Analytics and Management Platform

Ascend is a data analytics and data management platform designed to help companies organize, analyze, and visualize their data. It provides tools for data preparation, reporting, and predictive analytics.

What is Ascend?

Ascend is a flexible data analytics and data management platform used by organizations to wrangle, analyze, and gain valuable insights from their data. Some key features of Ascend include:

  • Data integration and ETL to bring together data from multiple sources
  • Interactive data preparation with profiling, cleansing, merging, and reshaping capabilities
  • Visual data exploration with drag-and-drop charts, graphs, pivot tables, and dashboards
  • Enterprise-grade governance with advanced security, access controls, and metadata management
  • Collaboration features to annotate, discuss findings, and share content
  • AI assistant and autoML to automatically profile data sets, suggest transformations, find insights, and build models
  • Scalability to handle large and complex data volumes across departments and teams

Ascend enables self-service analytics at scale so organizations can democratize data access, accelerate insights, and optimize decisions. The flexible architecture allows it to be deployed on-premises, in the cloud, or in hybrid environments. Overall, Ascend provides a complete data analytics toolkit for gaining valuable business insights from data.

Ascend Features

Features

  1. Data preparation
  2. Reporting and dashboards
  3. Predictive analytics
  4. Data visualization
  5. Data pipeline management
  6. Collaboration tools

Pricing

  • Subscription-Based

Pros

Intuitive drag-and-drop interface

Powerful data transformation capabilities

Many integrations with data sources and BI tools

Scalable to handle large data volumes

Good support for predictive modeling and machine learning

Cons

Steep learning curve

Requires expertise to fully utilize advanced features

Limited customization options for dashboards

Only available as cloud SaaS


The Best Ascend Alternatives

Top Ai Tools & Services and Data Analytics and other similar apps like Ascend


R (programming language) icon

R (programming language)

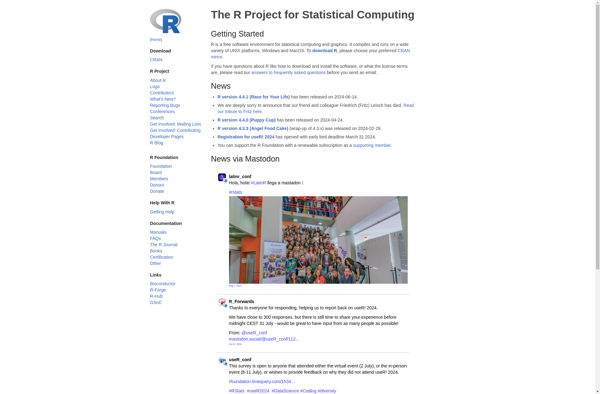
R is an open-source programming language and free software environment for statistical computing, bioinformatics, graphics, data science, and general-purpose programming. The R language provides a wide variety of statistical analysis techniques and graphical capabilities which make it a popular choice for data analysis and visualization.Some key features of R include:Open-source...
R (programming language) image
PTC Mathcad icon

PTC Mathcad

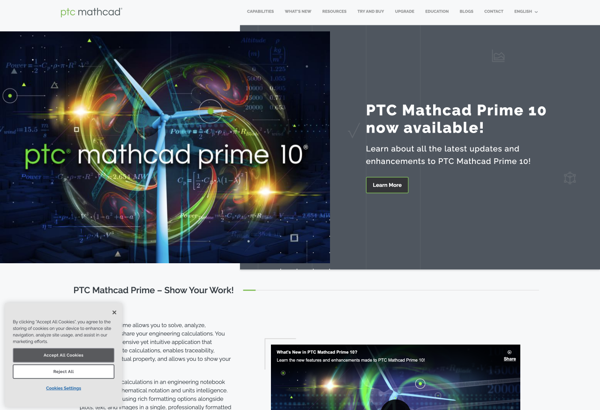
PTC Mathcad is an engineering calculation software developed by PTC used primarily for solving, analyzing, and sharing critical engineering design knowledge. First introduced in 1986, Mathcad combines a professional design environment with the easy usability of paper and pencil.Mathcad allows engineers to capture and document their critical design projects and...
PTC Mathcad image
IBM SPSS Statistics icon

IBM SPSS Statistics

IBM SPSS Statistics is a comprehensive software platform for statistical analysis in business, science, and social science research. First released in 1968, SPSS Statistics helps users apply complex statistical analyses and predictive analytics to unlock impactful insights from data.Key features and capabilities of SPSS Statistics include:Descriptive statistics like means, standard...
IBM SPSS Statistics image
Mathematica icon

Mathematica

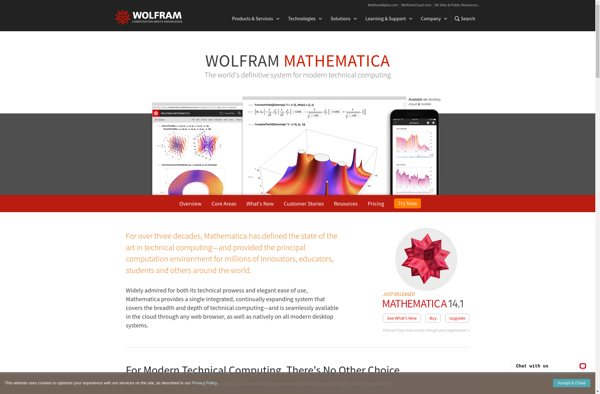
Mathematica is a computational software program developed by Wolfram Research. It is used for symbolic and numerical mathematics, data visualization, image processing, and a wide range of technical computing applications.Some key features of Mathematica include:A symbolic algebra engine that can manipulate mathematical expressions, solve equations, simplify expressions, compute derivatives and...
Mathematica image
MATLAB icon

MATLAB

MATLAB (matrix laboratory) is a multi-paradigm numerical computing environment and proprietary programming language developed by MathWorks. MATLAB allows matrix manipulations, plotting of functions and data, implementation of algorithms, creation of user interfaces, and interfacing with programs written in other languages.Some key features of MATLAB include:Matrix and array-oriented language for faster...
MATLAB image
Scilab icon

Scilab

Scilab is an open source, cross-platform numerical computational package and a high level, numerically oriented programming language. It provides an interpreted programming language, linear algebra operations, numerical optimization, signal processing features, and the ability to plot functions and data.Originally created in 1990 by researchers from INRIA and ENPC in France,...
Scilab image
GNU Octave icon

GNU Octave

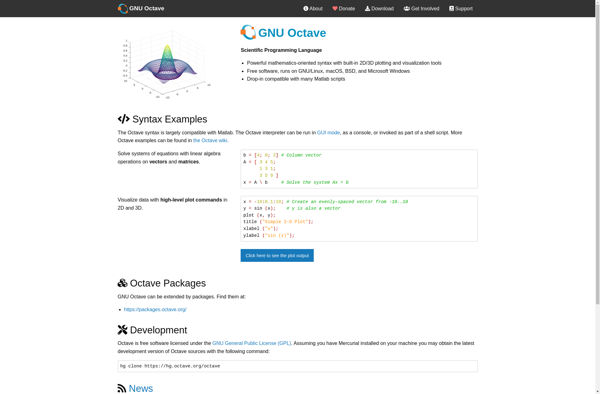
GNU Octave is an open-source mathematical programming language and environment that is compatible with MATLAB. It allows users to perform numerical computations, data manipulation and visualization, and other mathematical tasks. Some key features of GNU Octave include:An extensive library of mathematical functions for linear algebra, differential equations, optimization, statistics, and...
GNU Octave image
Maxima icon

Maxima

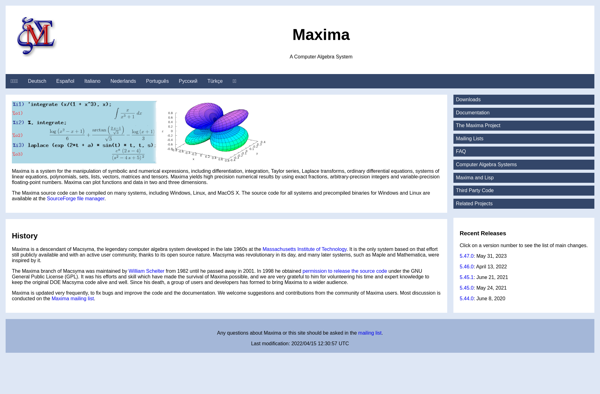
Maxima is a feature-rich open source computer algebra system that provides capabilities for symbolic computation and mathematical modeling. First released in 1968, Maxima descends from DOE Macsyma, one of the oldest such systems still in use and development today.Some of the key features and capabilities of Maxima include:Symbolic manipulation of...
Maxima image
SageMath icon

SageMath

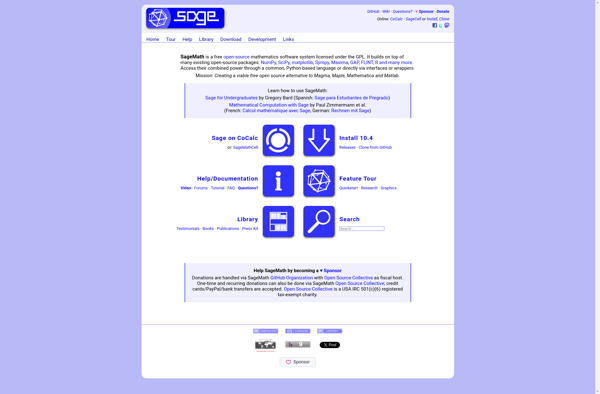
SageMath is an open-source mathematics software system that provides a viable free open source alternative to Magma, Maple, Mathematica and MATLAB. It is based on Python and implements a huge range of mathematics functionality including:Algebra - including commutative algebra, group theory, combinatorics, graph theory, exact linear algebra, and moreCalculus -...
SageMath image
WxMaxima icon

WxMaxima

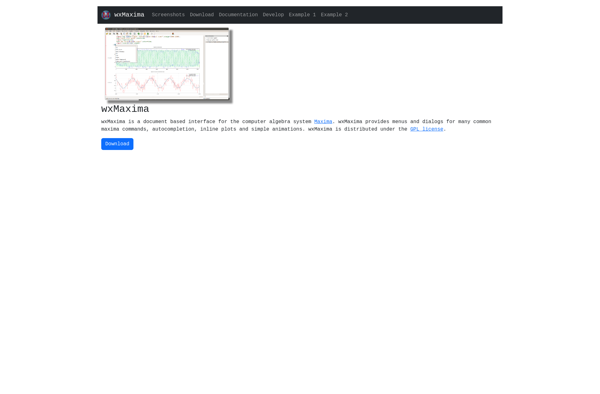
wxMaxima is a cross-platform and open source graphical user interface for the computer algebra system Maxima. It allows users to access Maxima's powerful symbolic and numerical capabilities through a simple, intuitive interface without needing to learn Maxima's command line syntax.Some key features and capabilities of wxMaxima include:Symbolic manipulations and calculations...
WxMaxima image
Spyder icon

Spyder

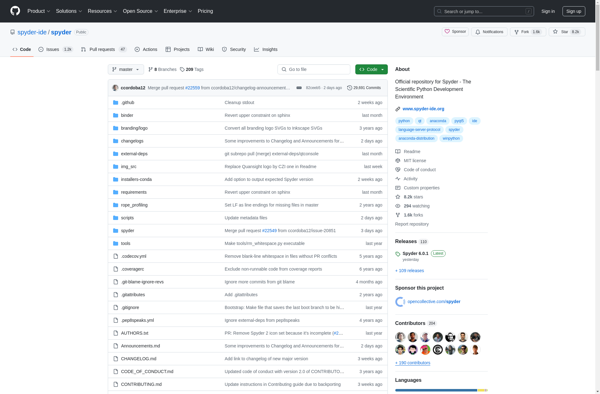
Spyder is a powerful Python integrated development environment (IDE) with features tailored towards scientific computing and data analysis. It provides the following key capabilities:Advanced editor with syntax highlighting, code completion, variable explorer, and other features to facilitate Python coding.Interactive Python console for testing code snippets and exploring data.Data explorer for...
Spyder image
GraphCalc icon

GraphCalc

GraphCalc is a feature-rich graphical calculator software application aimed primarily at high school and college students studying math and science. It allows users to easily plot a wide variety of 2D and 3D functions and visualize them interactively in order to gain deeper mathematical understanding.Key features of GraphCalc include:Intuitive graphical...
GraphCalc image
Datawrapper icon

Datawrapper

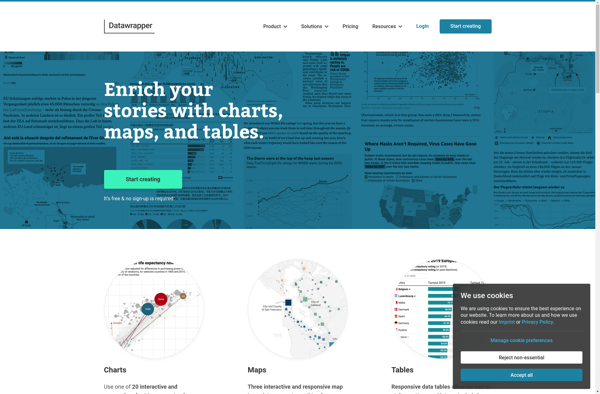
Datawrapper is a powerful yet user-friendly data visualization tool used by journalists, researchers, NGOs, and businesses to create interactive charts, graphs, and maps. Its drag-and-drop interface makes it easy for anyone to visualize data without needing to know how to code.Some key features of Datawrapper include:Various chart types including bar...
Datawrapper image
Mathmatiz icon

Mathmatiz

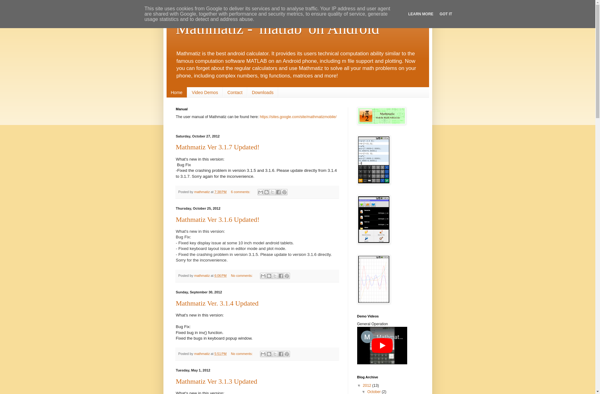
Mathmatiz is a free and open-source software designed for mathematics education. It includes features found in general graphing calculators as well as specialized mathematical tools.Mathmatiz allows students to visualize mathematical concepts through 2D and 3D graphing. It can graph a wide variety of functions and equations. The graphs can be...
Mathmatiz image
Mathics icon

Mathics

Mathics is an open-source computer algebra system designed to be compatible with Mathematica. It provides capabilities for symbolic and numerical calculations, 2D and 3D graphics, mathematical typesetting, and interactive use.Some of the key features of Mathics include:Symbolic calculations - simplify expressions, compute derivatives, integrals, limits, solve equations, etc.Numeric computations -...
Mathics image
VisSim icon

VisSim

VisSim is a visual block diagram software used for simulating dynamic systems and modeling physical processes. It provides a graphical programming environment for creating models by connecting functional blocks, with no need for text-based coding.Some key features of VisSim include:Drag-and-drop interface for quickly building models by connecting block diagramsExtensive library...
VisSim image
Anoc Octave Editor icon

Anoc Octave Editor

Anoc Octave Editor is a free and open source text editor designed specifically for the Octave programming language. It is part of the Anoc suite of software aimed primarily at Linux users.Some key features of Anoc Octave Editor include:Syntax highlighting for Octave codeCode folding to collapse blocks of codeIntegrated debugger...
Anoc Octave Editor image
Mathomatic icon

Mathomatic

Mathomatic is a free and open-source computer algebra system (CAS) software designed for symbolic mathematics and numerical calculations. Developed in portable C, Mathomatic can run on various platforms like Linux, Windows, macOS, and Unix.Mathomatic provides a simple yet powerful environment to perform a wide range of mathematical operations seamlessly. It...
Mathomatic image