Statwing is a user-friendly statistical analysis software designed for non-technical users. It provides an intuitive drag-and-drop interface to conduct statistical tests, make customizable graphs, and generate reports.
Statwing offers a non-technical user interface for conducting statistical tests, creating customizable graphs, and generating reports with ease
What is Statwing?
Statwing is a cloud-based statistical analysis and reporting software designed for ease of use by non-technical people. It provides an intuitive drag-and-drop interface that allows users to quickly conduct statistical tests, make customizable graphs and charts, and generate reports without coding.
Some key features of Statwing include:
Conduct common statistical tests like t-tests, ANOVA, correlation, regression and more
Visualize data with histograms, box plots, scatter plots, bar charts, and other graph types
Generate statistical reports with explanations of analysis and insights
Collaborate with others by sharing projects and adding comments
Import/export data from Excel, CSV, databases and other sources
Available via web browser - no installation needed
Secure cloud storage for data and analysis
With an easy-to-navigate workflow and menu system guiding users, Statwing makes statistical analysis accessible to beginners as well as experts. Its collaboration features also make it helpful for teams and organizations looking to make data-driven decisions.
Statwing Features
Features
Drag-and-drop interface for uploading data
Automated data cleaning and transformation
Visual graph and chart creation
Statistical analysis tools like t-tests, ANOVA, regression
Collaboration tools for sharing projects and results
R is an open-source programming language and free software environment for statistical computing, bioinformatics, graphics, data science, and general-purpose programming. The R language provides a wide variety of statistical analysis techniques and graphical capabilities which make it a popular choice for data analysis and visualization.Some key features of R include:Open-source...
IBM SPSS Statistics is a comprehensive software platform for statistical analysis in business, science, and social science research. First released in 1968, SPSS Statistics helps users apply complex statistical analyses and predictive analytics to unlock impactful insights from data.Key features and capabilities of SPSS Statistics include:Descriptive statistics like means, standard...
Minitab is a comprehensive software package used for statistical analysis and quality improvement applications. It has a wide range of analytical capabilities including basic statistics, regression analysis, design of experiments, statistical process control charts, reliability analysis, and more.Some key features and benefits of Minitab:User-friendly spreadsheet-style interface for entering, viewing, and...
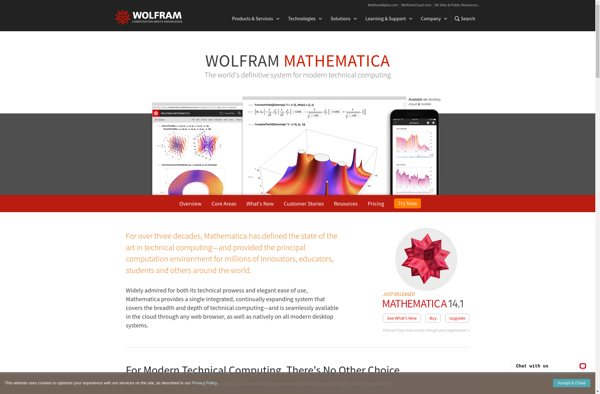
Mathematica is a computational software program developed by Wolfram Research. It is used for symbolic and numerical mathematics, data visualization, image processing, and a wide range of technical computing applications.Some key features of Mathematica include:A symbolic algebra engine that can manipulate mathematical expressions, solve equations, simplify expressions, compute derivatives and...
MATLAB (matrix laboratory) is a multi-paradigm numerical computing environment and proprietary programming language developed by MathWorks. MATLAB allows matrix manipulations, plotting of functions and data, implementation of algorithms, creation of user interfaces, and interfacing with programs written in other languages.Some key features of MATLAB include:Matrix and array-oriented language for faster...
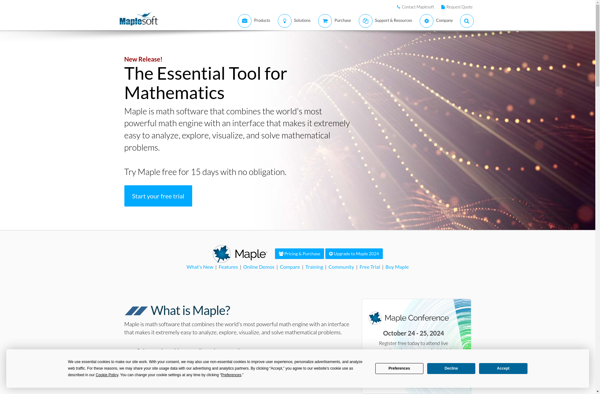
Maple is a proprietary computer algebra system or CAS designed for mathematical computation and modeling. It was first developed in 1980 by the Symbolic Computation Group at the University of Waterloo in Canada.Some of the key capabilities Maple offers include:Algebraic manipulation - simplify expressions, solve equations, factor polynomials, compute limits,...
RStudio is a popular open-source IDE for R, a programming language for statistical computing and graphics. It provides a user-friendly graphical user interface that makes working with R much easier by integrating tools for plotting, debugging, workspace management, and other features.Some key features of RStudio include:Code editor with syntax highlighting,...
PSPP is a free and open source alternative to the proprietary IBM SPSS Statistics software. It aims to provide similar capabilities and features for statistical analysis, data management, and graphics as SPSS Statistics does, while being available at no cost under the GNU General Public License.Some key features and capabilities...
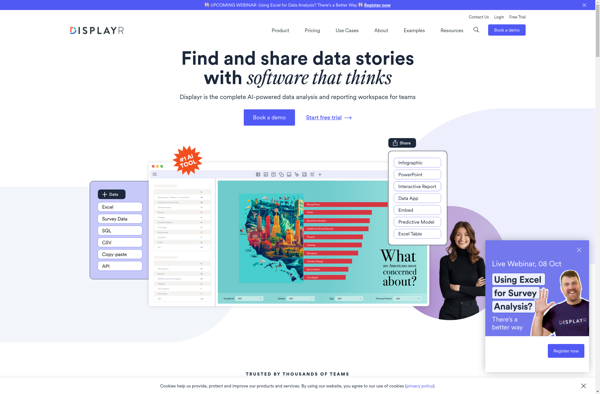
Displayr is a comprehensive business intelligence and data analytics platform designed to help companies analyze and visualize their data, build predictive models, and create interactive business analytics applications. Some key features and capabilities of Displayr include:Intuitive drag and drop interface to easily create reports, dashboards, analyses, and predictive models without...
SymPy is an open-source Python library for symbolic mathematics. It enables users to manipulate mathematical expressions, solve equations, expand functions into series, calculate limits, take derivatives and integrals, work with matrices, plot graphs, and more.Some key features of SymPy include:Symbolic calculation engine that can perform arithmetic, algebra, calculus, discrete math,...
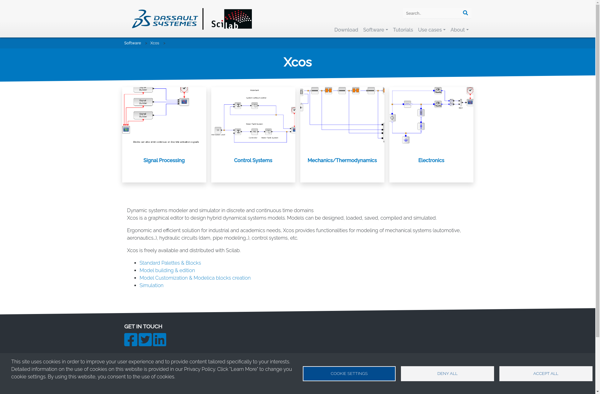
Xcos is an open-source software specialized in the simulation of dynamical systems, offering modeling and simulation features specifically oriented towards control systems. It is developed as a graphical user interface module for Scilab, the open source platform for numerical computation.Some key features of Xcos include:Block diagram model editor for building...
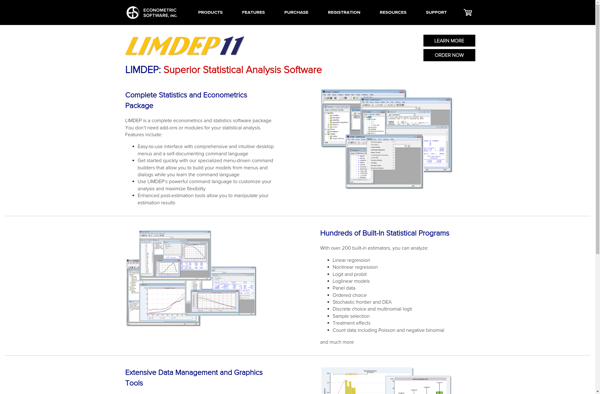
LIMDEP (Limited Dependent Variable Modeling) is proprietary econometrics software developed and sold by Econometric Software, Inc. It is used by economists, statisticians, analysts, and other researchers for economic modeling, forecasting, data analysis, and policy evaluation.Some key features of LIMDEP include:Tools for estimating a wide variety of econometric models including regression...
The R Commander is a basic-statistics graphical user interface for R, an open source programming language and software environment for statistical analysis, data manipulation, and graphics visualization. The R Commander provides a simple way to utilize many R features through menus, dialog boxes, and other user interface controls rather than...
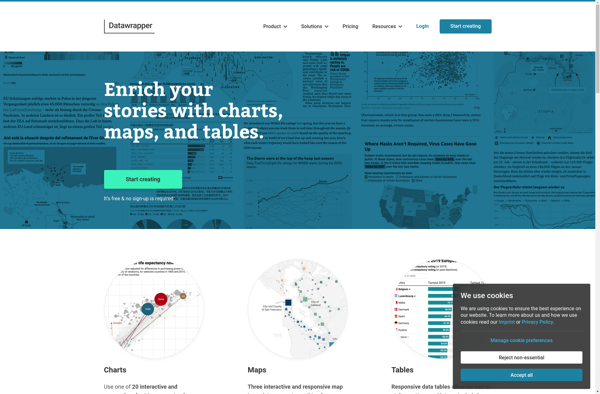
Datawrapper is a powerful yet user-friendly data visualization tool used by journalists, researchers, NGOs, and businesses to create interactive charts, graphs, and maps. Its drag-and-drop interface makes it easy for anyone to visualize data without needing to know how to code.Some key features of Datawrapper include:Various chart types including bar...
The Six Sigma Calculator is a free online tool designed to help quality professionals, students, and others perform common statistical calculations used in Six Sigma and quality improvement projects. With an easy-to-use interface, it includes the following key features and functions:Process Capability Analysis - Calculate Cp, Cpk, Pp, Ppk, and...
Q Research Software is a powerful qualitative data analysis application designed specifically for academic researchers across disciplines. It provides sophisticated tools to import, organize, code, annotate, analyze, and share a wide variety of data including text documents, images, audio files, videos, social media data, web content, surveys, and more.Key features...
OfficeReports is a business intelligence and analytics solution built specifically for Microsoft Office users. It allows you to create interactive reports, dashboards, and data visualizations directly from Excel, Word, and PowerPoint, without the need for special technical skills.With OfficeReports, you can quickly import data from multiple sources, including Excel workbooks,...
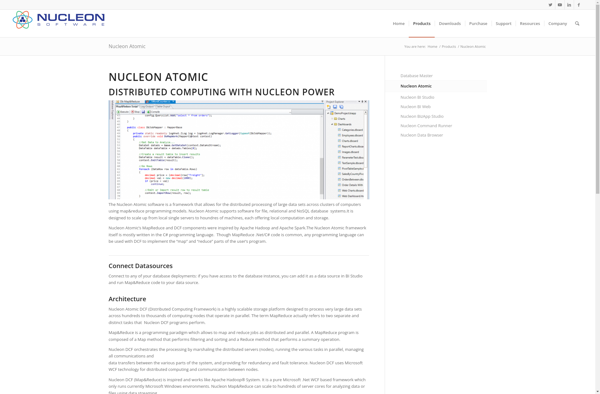
Nucleon BI Studio is a self-service business intelligence and analytics platform used by organizations to visualize, analyze, and share data insights. It provides an intuitive drag-and-drop interface that enables users without technical skills to easily build interactive dashboards, reports, and workflows to gain actionable insights from their data.Key capabilities and...
Variables is a user research and insights platform designed to help agile product teams validate ideas and make better product decisions. It provides an end-to-end solution to plan research, create flexible surveys, recruit participants from a global panel, analyze responses, and share insights.Key features include:Flexible survey builder with logic, images,...