Q Research Software

Q Research Software: Qualitative Data Analysis Tool
Q Research Software is a qualitative data analysis software designed for academic researchers. It supports the analysis of text, images, audio, and video with tools for coding, annotating, and exploring themes and patterns.
What is Q Research Software?
Q Research Software is a powerful qualitative data analysis application designed specifically for academic researchers across disciplines. It provides sophisticated tools to import, organize, code, annotate, analyze, and share a wide variety of data including text documents, images, audio files, videos, social media data, web content, surveys, and more.
Key features include an intuitive user interface optimized for qualitative coding and analysis; support for team-based collaboration with version control; powerful search and retrieval to quickly find coded text across entire datasets; visualizations and analytical functions to explore code co-occurrences, relationships between codes, and model conceptual relationships; tools to compare coding patterns between documents, groups of documents, or team members; customizable reports; and capabilities to export all project data, codebooks, coded data, and analysis outcomes.
Q Research Software aims to support rigorous qualitative methodology while dramatically reducing the manual effort of qualitative coding and analysis. Its specialized tools are designed to help qualitative researchers quickly uncover conceptual relationships and develop empirically-grounded theories from qualitative datasets in a systematic, transparent, and collaborative manner.
Q Research Software Features
Features
- Text analysis
- Image analysis
- Audio analysis
- Video analysis
- Coding and annotating data
- Identifying themes and patterns
Pricing
- Subscription-Based
- Academic Discounts
Pros
Cons
Official Links
Reviews & Ratings
Login to ReviewThe Best Q Research Software Alternatives
View all Q Research Software alternatives with detailed comparison →
Top Education & Reference and Academic Research and other similar apps like Q Research Software
Here are some alternatives to Q Research Software:
Suggest an alternative ❐R (programming language)

IBM SPSS Statistics

RStudio

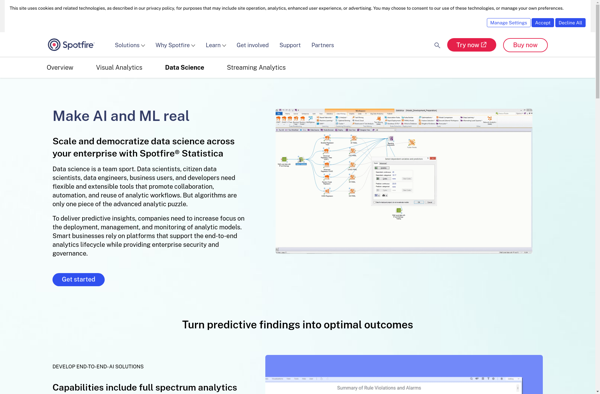
STATISTICA
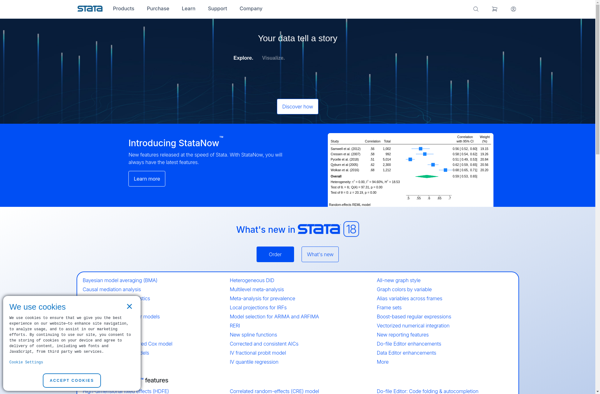
Stata
PSPP

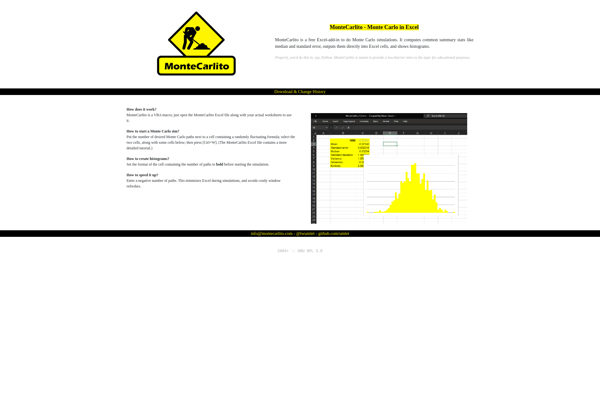
Montecarlito
Tinn-R
Statwing
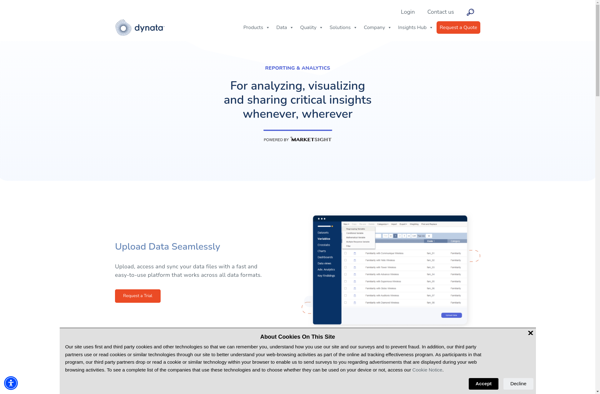
MarketSight