Variables is a user research platform that helps teams conduct research faster. It allows you to create flexible surveys, recruit participants, analyze responses, and share insights quickly. Great for agile teams that need ongoing customer feedback.
Create flexible surveys, recruit participants, analyze responses, and share insights with Variables, the ultimate tool for agile teams seeking ongoing customer feedback
What is Variables?
Variables is a user research and insights platform designed to help agile product teams validate ideas and make better product decisions. It provides an end-to-end solution to plan research, create flexible surveys, recruit participants from a global panel, analyze responses, and share insights.
Key features include:
Flexible survey builder with logic, images, and more
Access to on-demand research participants from a diverse global panel
Automated analysis with charts, filters, and exports
Collaboration tools to involve your team and stakeholders
Integrations with popular platforms like Jira, Slack, Figma, etc.
Variables is ideal for agile development teams that need ongoing qualitative insights from real users to guide their product roadmap. The flexible, DIY approach means you can run studies on your own timeline without reliance on a research team. This helps validate ideas faster and course-correct based on user feedback.
Overall, Variables is a great user research platform for technology and digital product teams that want easy access to participants and insights in order to build products their customers love.
R is an open-source programming language and free software environment for statistical computing, bioinformatics, graphics, data science, and general-purpose programming. The R language provides a wide variety of statistical analysis techniques and graphical capabilities which make it a popular choice for data analysis and visualization.Some key features of R include:Open-source...
IBM SPSS Statistics is a comprehensive software platform for statistical analysis in business, science, and social science research. First released in 1968, SPSS Statistics helps users apply complex statistical analyses and predictive analytics to unlock impactful insights from data.Key features and capabilities of SPSS Statistics include:Descriptive statistics like means, standard...
RStudio is a popular open-source IDE for R, a programming language for statistical computing and graphics. It provides a user-friendly graphical user interface that makes working with R much easier by integrating tools for plotting, debugging, workspace management, and other features.Some key features of RStudio include:Code editor with syntax highlighting,...
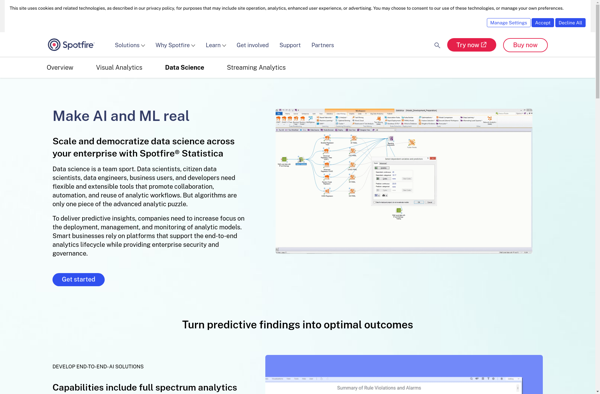
STATISTICA is a powerful and comprehensive data analysis software suite that has been developed over 30+ years by StatSoft. It provides analytics capabilities for a wide range of industries and applications.Key features of STATISTICA include:Advanced data visualization with interactive dashboards, graphs and chartsPredictive analytics and data mining algorithms like regression,...
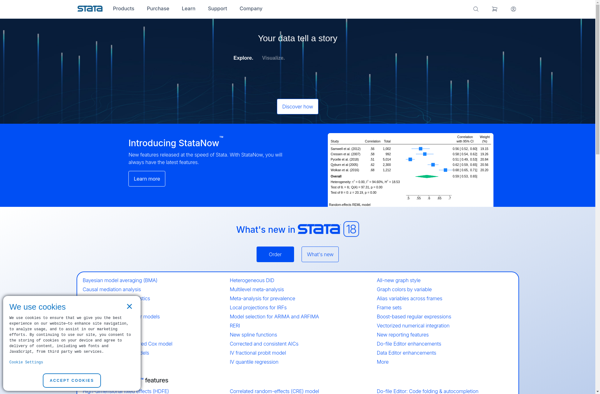
Stata is statistical software that is widely used by researchers in economics, political science, biomedicine, sociology, and other fields that require advanced statistical analysis and data visualization capabilities. It was first launched in 1985 by StataCorp and has since become one of the most popular statistical packages in academic research.Some...
Deducer is a user-friendly open-source data analysis software aimed at beginners looking to learn statistics and data analysis using R without having to code. It was designed by academic researchers to be a free easy-to-use alternative to proprietary statistical software packages.Deducer provides a graphical user interface to R that allows...
PSPP is a free and open source alternative to the proprietary IBM SPSS Statistics software. It aims to provide similar capabilities and features for statistical analysis, data management, and graphics as SPSS Statistics does, while being available at no cost under the GNU General Public License.Some key features and capabilities...
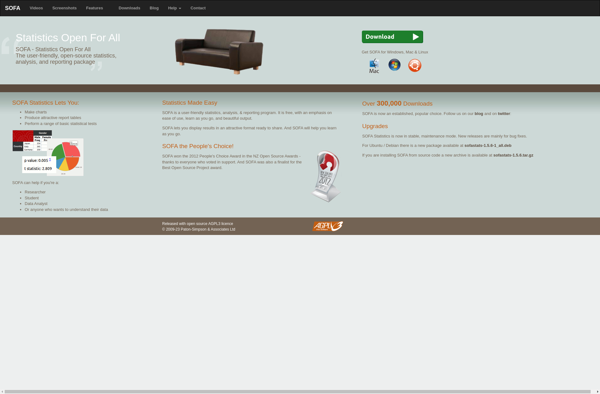
SOFA Statistics is a user-friendly, open-source statistics, analysis, and reporting tool that runs as a desktop application on Windows, Mac, and Linux. It provides an extensive range of statistical methods and visualization tools for exploratory data analysis, data cleaning, model fitting, results reporting, and dashboard creation.Some key features of SOFA...
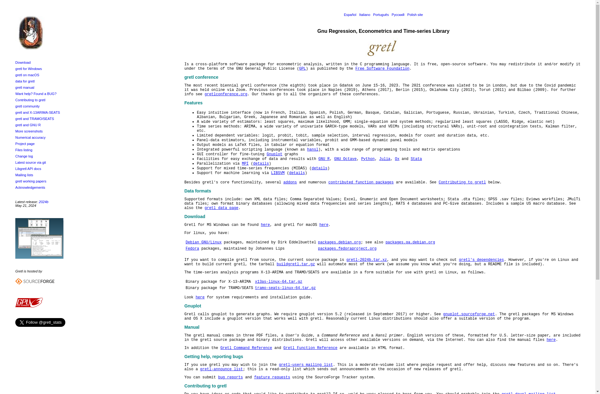
gretl is an open-source software package for econometric analysis. It supports a wide range of statistical techniques relevant to econometrics, such as cross-section, panel data, time series, nonparametric estimators, maximum likelihood, and general nonlinear least squares.Some key features of gretl include:User-friendly graphical interface for data entry, analysis, and visualizationScripting functionality...
PAST is a comprehensive, user-friendly software package for scientific data analysis, with a focus on paleontology and paleobiology research. Developed by researchers at the University of Oslo, PAST provides a wide range of analytical tools and statistical tests within an intuitive graphical user interface.Key features of PAST include:Data manipulation -...
Statwing is a cloud-based statistical analysis and reporting software designed for ease of use by non-technical people. It provides an intuitive drag-and-drop interface that allows users to quickly conduct statistical tests, make customizable graphs and charts, and generate reports without coding.Some key features of Statwing include:Conduct common statistical tests like...