Displayr

Displayr

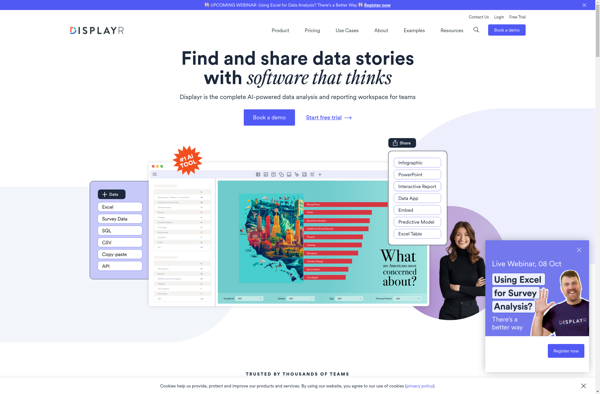
Displayr is a business intelligence and data analytics software that allows users to analyze data and create reports, dashboards, and business analytics apps. It is known for its ease of use, interactive analytics, predictive modeling, and streamlined business intelligence.
Displayr image
data-analytics business-intelligence reporting dashboards

Displayr: Business Intelligence & Data Analytics Software

Displayr is a business intelligence and data analytics software that allows users to analyze data and create reports, dashboards, and business analytics apps. It is known for its ease of use, interactive analytics, predictive modeling, and streamlined business intelligence.

What is Displayr?

Displayr is a comprehensive business intelligence and data analytics platform designed to help companies analyze and visualize their data, build predictive models, and create interactive business analytics applications. Some key features and capabilities of Displayr include:

  • Intuitive drag and drop interface to easily create reports, dashboards, analyses, and predictive models without requiring coding
  • Powerful statistical capabilities and AI-powered analytics for deep insights from data
  • Wide range of visualizations and charts to understand data trends and tell impactful data stories
  • Collaboration features to share reports and analytics apps with team members
  • Automated report generation and distribution to keep key stakeholders informed
  • Advanced mapping capabilities for analyzing geographic data
  • Application building tools to create customizable, interactive analytics apps and dashboards
  • Open architecture and ability to connect to a wide variety of data sources
  • Integrations with business platforms like Shopify, Salesforce, HubSpot, and Marketo

With its user-friendly and self-serve approach, Displayr makes it easy for businesses to transform their raw data into valuable, actionable insights. It's an affordable yet powerful option for small, mid-sized and large enterprise organizations seeking a modern business intelligence solution.

Displayr Features

Features

  1. Drag-and-drop interface for building dashboards
  2. Interactive data visualization and analytics
  3. Automated predictive modeling and machine learning
  4. Data preparation and ETL capabilities
  5. Collaboration tools for sharing insights
  6. APIs for embedding analytics
  7. Mobile app for accessing analytics on the go

Pricing

  • Freemium
  • Subscription-Based

Pros

Very easy to use and intuitive

Powerful analytics capabilities

Great for non-technical users

Interactive data visualizations

Automates predictive modeling

Scales to large data sets

Cons

Can be pricey for smaller businesses

Less customizable than open source options

Limited free version

Steep learning curve for advanced analytics


The Best Displayr Alternatives

Top Business & Commerce and Business Intelligence & Analytics and other similar apps like Displayr


IBM SPSS Statistics icon

IBM SPSS Statistics

IBM SPSS Statistics is a comprehensive software platform for statistical analysis in business, science, and social science research. First released in 1968, SPSS Statistics helps users apply complex statistical analyses and predictive analytics to unlock impactful insights from data.Key features and capabilities of SPSS Statistics include:Descriptive statistics like means, standard...
IBM SPSS Statistics image
RStudio icon

RStudio

RStudio is a popular open-source IDE for R, a programming language for statistical computing and graphics. It provides a user-friendly graphical user interface that makes working with R much easier by integrating tools for plotting, debugging, workspace management, and other features.Some key features of RStudio include:Code editor with syntax highlighting,...
RStudio image
STATISTICA icon

STATISTICA

STATISTICA is a powerful and comprehensive data analysis software suite that has been developed over 30+ years by StatSoft. It provides analytics capabilities for a wide range of industries and applications.Key features of STATISTICA include:Advanced data visualization with interactive dashboards, graphs and chartsPredictive analytics and data mining algorithms like regression,...
STATISTICA image
Stata icon

Stata

Stata is statistical software that is widely used by researchers in economics, political science, biomedicine, sociology, and other fields that require advanced statistical analysis and data visualization capabilities. It was first launched in 1985 by StataCorp and has since become one of the most popular statistical packages in academic research.Some...
Stata image
PSPP icon

PSPP

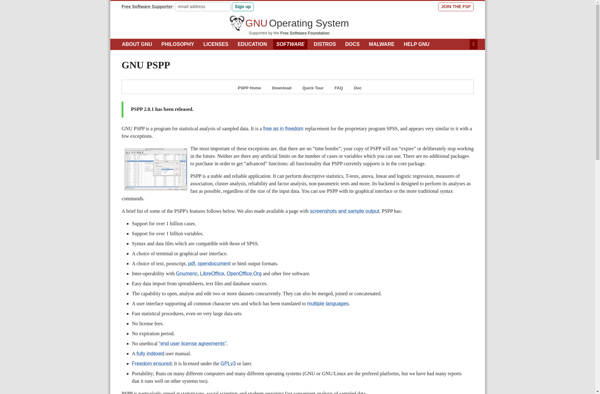
PSPP is a free and open source alternative to the proprietary IBM SPSS Statistics software. It aims to provide similar capabilities and features for statistical analysis, data management, and graphics as SPSS Statistics does, while being available at no cost under the GNU General Public License.Some key features and capabilities...
PSPP image
Montecarlito icon

Montecarlito

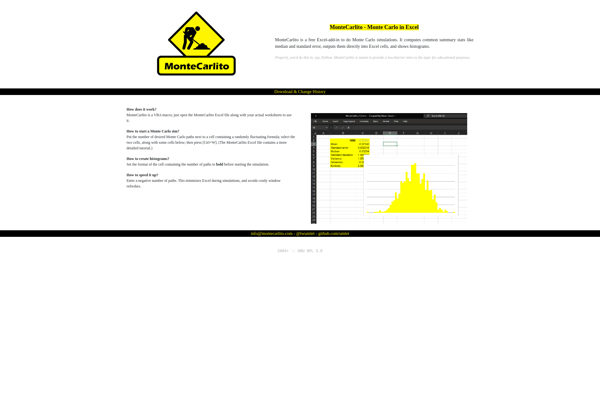
Montecarlito is an open-source typeface inspired by Times New Roman. It was created in 2018 by typographers Cadson Demak and Jacques Le Bailly to provide an alternative typeface that avoids the licensing restrictions of Times New Roman.Montecarlito has the same metrics as Times New Roman so it can be used...
Montecarlito image
Tinn-R icon

Tinn-R

Tinn-R is an open-source, cross-platform text editor and integrated development environment (IDE) designed specifically for the R programming language. It provides a range of useful features for R developers, including:Syntax highlighting for R codeSmart autocompletion of R functions and objectsIntegrated R console for running code directly within the editorProject management...
Tinn-R image
Chartrics icon

Chartrics

Chartrics is a powerful yet easy-to-use data visualization and analytics platform for creating interactive charts, graphs, and dashboards. With its intuitive drag-and-drop interface, anyone can quickly turn raw data into meaningful visualizations and share insights.Key features of Chartrics include:Import data from a variety of sources like CSVs, databases, and other...
Chartrics image
Statwing icon

Statwing

Statwing is a cloud-based statistical analysis and reporting software designed for ease of use by non-technical people. It provides an intuitive drag-and-drop interface that allows users to quickly conduct statistical tests, make customizable graphs and charts, and generate reports without coding.Some key features of Statwing include:Conduct common statistical tests like...
Statwing image