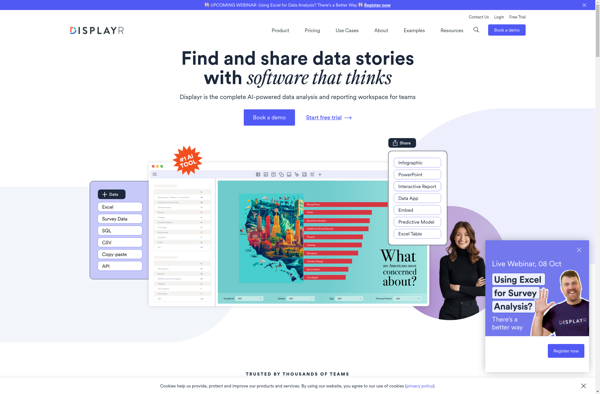
Displayr
Description: Displayr is a business intelligence and data analytics software that allows users to analyze data and create reports, dashboards, and business analytics apps. It is known for its ease of use, interactive analytics, predictive modeling, and streamlined business intelligence.
Type: software
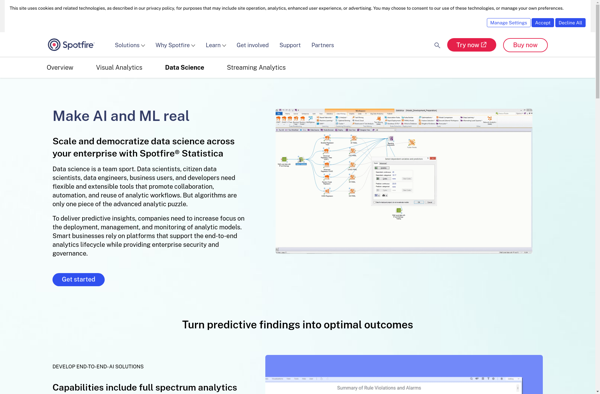
STATISTICA
Description: STATISTICA is a comprehensive data analysis software suite developed by StatSoft. It provides a wide range of analytics capabilities including data visualization, predictive modeling, data mining, forecasting, quality control charts, and more.
Type: software