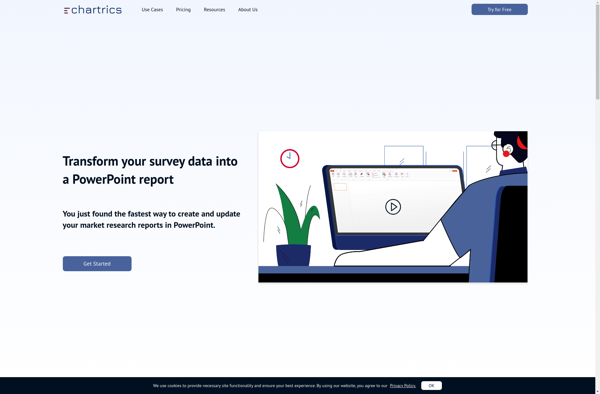
Chartrics is a data visualization and analytics software that allows users to easily create interactive charts, graphs, and dashboards to visualize data. It has drag-and-drop functionality to make chart building simple.
Chartrics: Data Visualization and Analytics Software
Chartrics is a data visualization and analytics software that allows users to easily create interactive charts, graphs, and dashboards to visualize data. It has drag-and-drop functionality to make chart building simple.
What is Chartrics?
Chartrics is a powerful yet easy-to-use data visualization and analytics platform for creating interactive charts, graphs, and dashboards. With its intuitive drag-and-drop interface, anyone can quickly turn raw data into meaningful visualizations and share insights.
Key features of Chartrics include:
Import data from a variety of sources like CSVs, databases, and other business intelligence tools
Choose from a library of chart types like bar, line, pie, scatter, maps, and more
Customize colors, labels, sorting, filtering to tailor visuals for your needs
Annotate and highlight elements of charts to draw attention to key data points
Build interactive dashboards by combining multiple charts and visualizations
Share and embed dashboards securely with other users or publish them publicly
Schedule automatic data refreshes and report distribution via emails or Slack
With robust visualization capabilities, ease of use, and flexible sharing options, Chartrics empowers any team to unlock greater data understanding and improve decision-making.
Chartrics Features
Features
Drag-and-drop interface for building charts
Supports wide range of chart types including bar, pie, line, scatter, etc
Interactive charts and dashboards
Connects to various data sources like Excel, CSV, databases
Collaboration tools for sharing dashboards
Customizable themes and styles
Scheduled report generation and distribution
Pricing
Freemium
Subscription-Based
Pros
Intuitive and easy to use
Great for non-technical users
Interactive visualizations make data exploration easy
Microsoft Power BI is a powerful business analytics service developed by Microsoft. It empowers users to transform raw data into meaningful insights, create interactive reports and dashboards, and share data-driven stories within an organization. Power BI is designed to help businesses and individuals make informed decisions based on a comprehensive...
Tableau is a leading business intelligence and data visualization platform used by organizations of all sizes to transform their data into easy-to-understand visualizations and dashboards. With Tableau, users can connect to a wide range of data sources, prepare and clean the data for analysis, and create interactive data visualizations such...
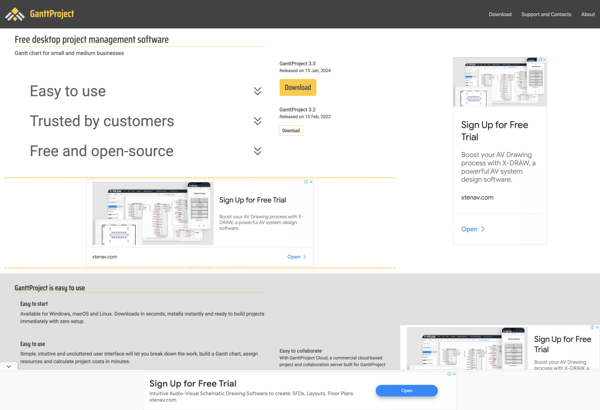
GanttProject is an open-source desktop application for project scheduling and management. It allows users to create Gantt charts to visualize project timelines and schedules. Key features include:Creating tasks and milestonesSetting task dependenciesAssigning resourcesTracking progressExporting charts to PDF or image filesGanttProject is designed for planning and tracking individual or team-based projects....
think-cell is a software suite designed to simplify the creation of professional-looking charts and presentations, particularly within the Microsoft Office environment. It is known for its integration with Microsoft PowerPoint and Excel, providing tools to streamline the design and formatting of complex charts and visual elements. Key Features: Chart Creation:...
QlikView is a business intelligence and data visualization platform used to create interactive dashboards and analytics applications. It was first released in 1993 by the Swedish company Qlik. Key features of QlikView include:Associative data modeling and in-memory analytics engine - Allows fast analysis of large, disparate datasets without predefined schema...
Sisense is a business intelligence and data analytics software platform designed to help non-technical users prepare, analyze and visualize complex data. Some key features of Sisense include:Intuitive drag-and-drop interface for building interactive dashboards and visualizations like charts, graphs and pivot tables without coding.Ability to connect to wide variety of data...
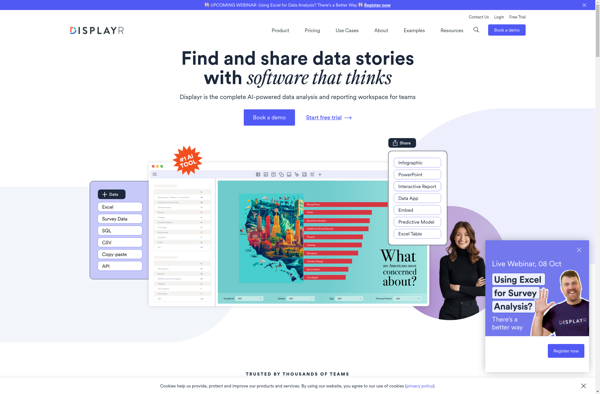
Displayr is a comprehensive business intelligence and data analytics platform designed to help companies analyze and visualize their data, build predictive models, and create interactive business analytics applications. Some key features and capabilities of Displayr include:Intuitive drag and drop interface to easily create reports, dashboards, analyses, and predictive models without...
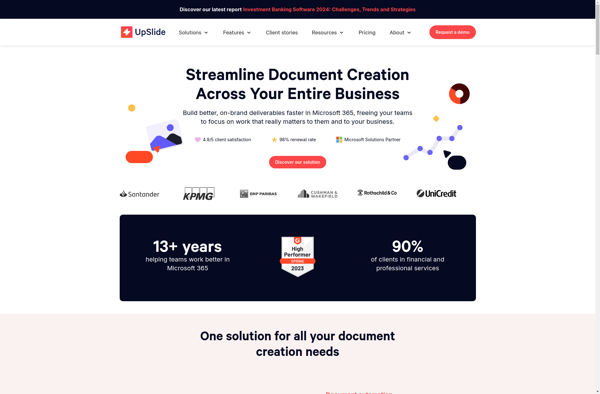
UpSlide is a cloud-based presentation software built for modern teams who create a lot of slide decks. It aims to provide an easy-to-use yet powerful alternative to traditional presentation tools.Some key features of UpSlide include:Drag-and-drop interface to quickly build presentationsNumerous professionally designed templates to choose fromCollaboration tools to work on...
Grunt.pro is a popular open-source JavaScript task runner used by web developers to automate repetitive tasks in their workflow. Some key features and benefits of Grunt.pro include:Automation of common development tasks like minification, compilation, linting, unit testing etc.Helps improve productivity by eliminating manual repetition of coding tasksEasy to integrate into...
OfficeReports is a business intelligence and analytics solution built specifically for Microsoft Office users. It allows you to create interactive reports, dashboards, and data visualizations directly from Excel, Word, and PowerPoint, without the need for special technical skills.With OfficeReports, you can quickly import data from multiple sources, including Excel workbooks,...