OfficeReports

OfficeReports

OfficeReports is a reporting and analytics tool designed for Microsoft Office. It allows users to easily create reports, dashboards, and visualizations from Excel, Word, and PowerPoint documents. Useful for business intelligence and data analysis.
OfficeReports image
business-intelligence data-analysis microsoft-office excel word powerpoint reports dashboards visualizations

OfficeReports: Reporting and Analytics Tool for Microsoft Office

OfficeReports is a reporting and analytics tool designed for Microsoft Office. It allows users to easily create reports, dashboards, and visualizations from Excel, Word, and PowerPoint documents. Useful for business intelligence and data analysis.

What is OfficeReports?

OfficeReports is a business intelligence and analytics solution built specifically for Microsoft Office users. It allows you to create interactive reports, dashboards, and data visualizations directly from Excel, Word, and PowerPoint, without the need for special technical skills.

With OfficeReports, you can quickly import data from multiple sources, including Excel workbooks, SQL databases, online apps, and more. Built-in connectors make it easy to connect your data sources. You can then use drag-and-drop tools to produce charts, tables, gauges and other visuals to create insightful reports and dashboards.

Sharing your work is easy too. OfficeReports has options to automate report delivery via email or publish results to your intranet. Collaboration features also allow teams to work together on reports and provide feedback.

Other key features include:

  • Custom report templates
  • Scheduled data refreshes
  • Detailed user permissions
  • Centralized report storage
  • Access from anywhere - desktop or mobile

If your business relies heavily on Excel, OfficeReports can save you time otherwise spent on manual reporting. It's an easy way empower Office users with better data analysis capabilities.

OfficeReports Features

Features

  1. Seamless integration with Microsoft Office suite
  2. Intuitive report and dashboard creation tools
  3. Advanced data visualization capabilities
  4. Collaborative features for sharing reports
  5. Customizable templates and layouts
  6. Real-time data updates and refreshes
  7. Automated report generation and scheduling

Pricing

  • Subscription-Based

Pros

Tight integration with familiar Microsoft Office tools

Powerful analytics and reporting functionality

User-friendly interface for non-technical users

Collaborative features for team-based reporting

Flexible customization options

Cons

Potential compatibility issues with older Office versions

Limited functionality compared to standalone BI tools

Steep learning curve for advanced features

Potential performance issues with large datasets


The Best OfficeReports Alternatives

Top Office & Productivity and Reporting & Analytics and other similar apps like OfficeReports


IBM SPSS Statistics icon

IBM SPSS Statistics

IBM SPSS Statistics is a comprehensive software platform for statistical analysis in business, science, and social science research. First released in 1968, SPSS Statistics helps users apply complex statistical analyses and predictive analytics to unlock impactful insights from data.Key features and capabilities of SPSS Statistics include:Descriptive statistics like means, standard...
IBM SPSS Statistics image
Minitab icon

Minitab

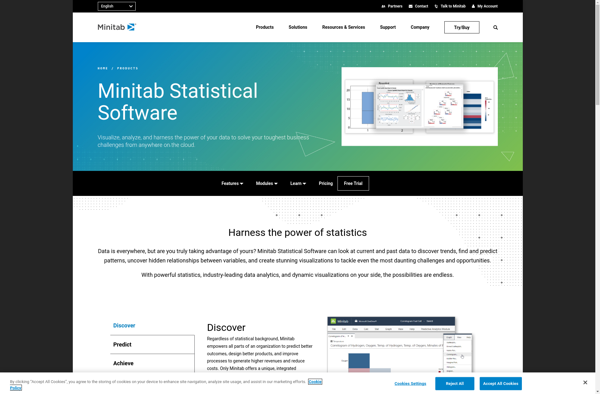
Minitab is a comprehensive software package used for statistical analysis and quality improvement applications. It has a wide range of analytical capabilities including basic statistics, regression analysis, design of experiments, statistical process control charts, reliability analysis, and more.Some key features and benefits of Minitab:User-friendly spreadsheet-style interface for entering, viewing, and...
Minitab image
RStudio icon

RStudio

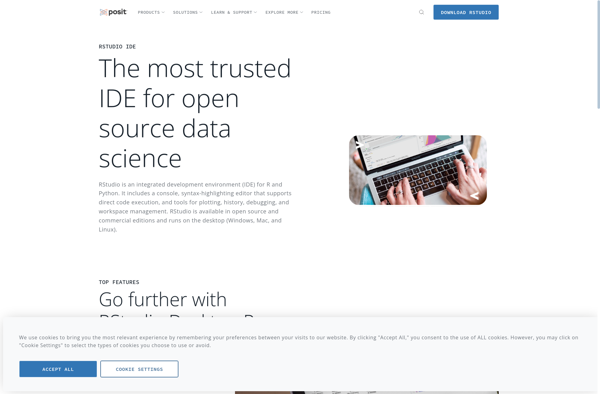
RStudio is a popular open-source IDE for R, a programming language for statistical computing and graphics. It provides a user-friendly graphical user interface that makes working with R much easier by integrating tools for plotting, debugging, workspace management, and other features.Some key features of RStudio include:Code editor with syntax highlighting,...
RStudio image
Stata icon

Stata

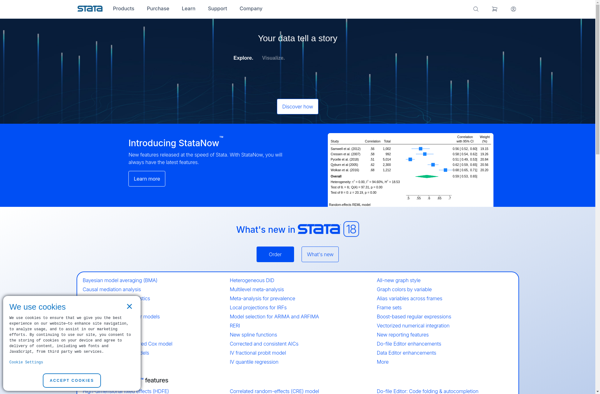
Stata is statistical software that is widely used by researchers in economics, political science, biomedicine, sociology, and other fields that require advanced statistical analysis and data visualization capabilities. It was first launched in 1985 by StataCorp and has since become one of the most popular statistical packages in academic research.Some...
Stata image
PSPP icon

PSPP

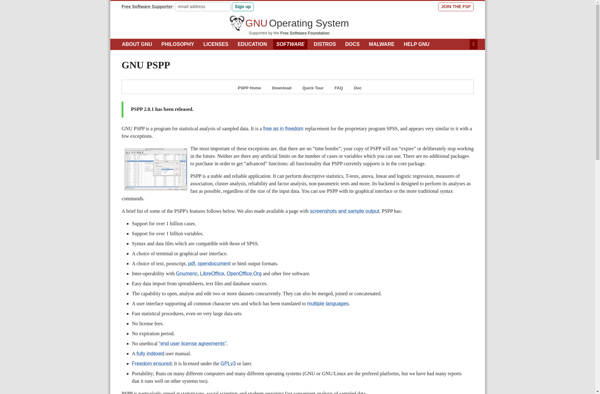
PSPP is a free and open source alternative to the proprietary IBM SPSS Statistics software. It aims to provide similar capabilities and features for statistical analysis, data management, and graphics as SPSS Statistics does, while being available at no cost under the GNU General Public License.Some key features and capabilities...
PSPP image
Montecarlito icon

Montecarlito

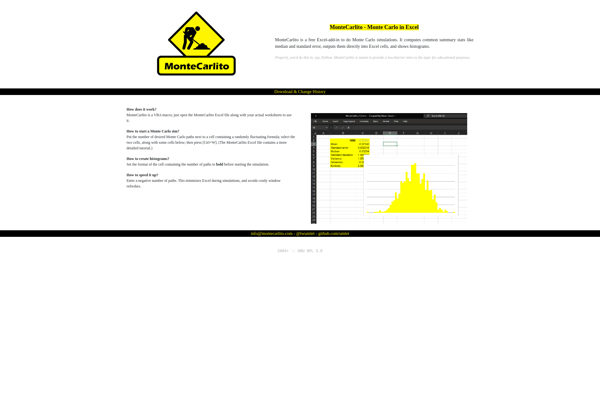
Montecarlito is an open-source typeface inspired by Times New Roman. It was created in 2018 by typographers Cadson Demak and Jacques Le Bailly to provide an alternative typeface that avoids the licensing restrictions of Times New Roman.Montecarlito has the same metrics as Times New Roman so it can be used...
Montecarlito image
The R Commander icon

The R Commander

The R Commander is a basic-statistics graphical user interface for R, an open source programming language and software environment for statistical analysis, data manipulation, and graphics visualization. The R Commander provides a simple way to utilize many R features through menus, dialog boxes, and other user interface controls rather than...
The R Commander image
Chartrics icon

Chartrics

Chartrics is a powerful yet easy-to-use data visualization and analytics platform for creating interactive charts, graphs, and dashboards. With its intuitive drag-and-drop interface, anyone can quickly turn raw data into meaningful visualizations and share insights.Key features of Chartrics include:Import data from a variety of sources like CSVs, databases, and other...
Chartrics image
Statwing icon

Statwing

Statwing is a cloud-based statistical analysis and reporting software designed for ease of use by non-technical people. It provides an intuitive drag-and-drop interface that allows users to quickly conduct statistical tests, make customizable graphs and charts, and generate reports without coding.Some key features of Statwing include:Conduct common statistical tests like...
Statwing image
MarketSight icon

MarketSight

MarketSight is a comprehensive marketing analytics platform designed to help B2B companies gain a deeper understanding of their customers and markets. The software provides powerful data analysis capabilities to track performance across all marketing channels and touchpoints.With MarketSight, marketers can:Analyze customer behavior and purchasing patternsIdentify high-lifetime-value customer segmentsEvaluate multi-channel campaign...
MarketSight image