QlikView is a business intelligence and data visualization software that allows users to create interactive dashboards and data apps. It provides data integration, analytics, and reporting capabilities in a single platform.
QlikView: Business Intelligence and Data Visualization Software
QlikView is a business intelligence and data visualization software that allows users to create interactive dashboards and data apps. It provides data integration, analytics, and reporting capabilities in a single platform.
What is QlikView?
QlikView is a business intelligence and data visualization platform used to create interactive dashboards and analytics applications. It was first released in 1993 by the Swedish company Qlik. Key features of QlikView include:
Associative data modeling and in-memory analytics engine - Allows fast analysis of large, disparate datasets without predefined schema constraints
Interactive dashboards and visualization - Drag-and-drop interface to build dashboards with charts, tables, gauges and maps
Self-service BI - Allows business users to easily create and share analytics apps without relying on IT
Data integration and ETL - Provides native data integration and extract, transform and load (ETL) capabilities
Mobile BI - QlikView dashboards can be accessed on mobile devices through the Qlik Sense mobile app
Advanced analytics functions - Includes statistical analysis, forecasting, clustering, predictive modeling within the data app
QlikView is useful for gaining faster business insights from multiple data sources. With its associative engine and visualization capabilities, it allows organizations to explore data freely without restrictions of predefined schemas. Common use cases include sales and marketing analytics, supply chain analytics, financial reporting and more.
Microsoft Power BI is a powerful business analytics service developed by Microsoft. It empowers users to transform raw data into meaningful insights, create interactive reports and dashboards, and share data-driven stories within an organization. Power BI is designed to help businesses and individuals make informed decisions based on a comprehensive...
Tableau is a leading business intelligence and data visualization platform used by organizations of all sizes to transform their data into easy-to-understand visualizations and dashboards. With Tableau, users can connect to a wide range of data sources, prepare and clean the data for analysis, and create interactive data visualizations such...
Talend is an open source data integration and management platform designed to help organizations effectively collect, transform, cleanse and share data across systems and teams. Some key capabilities and benefits of Talend include:Graphical drag-and-drop interface to build data integration jobs and workflows without codingOver 900 pre-built data connectors to leading...
Funnelytics is a comprehensive marketing analytics platform designed to help businesses visualize and optimize their conversion funnels and customer journeys. It integrates data from multiple sources like websites, ads, CRM systems, etc. to create a single customer view.Key features of Funnelytics include:Interactive conversion funnel analysis to identify sticking points and...
Pentaho is a comprehensive open source business intelligence (BI) suite that provides a range of data integration, analytics, visualization, reporting, data mining, and workflow capabilities. It is designed to help businesses consolidate data from disparate sources for unified analytics and reporting.Some of the key capabilities and components of Pentaho include:Data...
SAP BusinessObjects is a comprehensive business intelligence and analytics software suite from SAP. It brings together capabilities for reporting, analysis, dashboards, data visualization, data discovery, and more to help organizations unlock value from their data.Key capabilities and components of SAP BusinessObjects include:Centralized semantic layer for consistent data across the organizationPowerful...
Cluvio is a business intelligence and analytics software designed for small and medium-sized businesses. It aims to make data analytics accessible to non-technical users through an intuitive graphical interface. Some key capabilities and benefits of Cluvio include:Interactive dashboards - Users can create customizable dashboards to visualize important business metrics and...
Panxpan is a free and open source spreadsheet application that offers functionality and features comparable to Microsoft Excel. It allows users to create spreadsheets, organize and analyze data, create charts and graphs, perform calculations using formulae and functions, and collaborate with others.Some key features of Panxpan include:Import and export to...
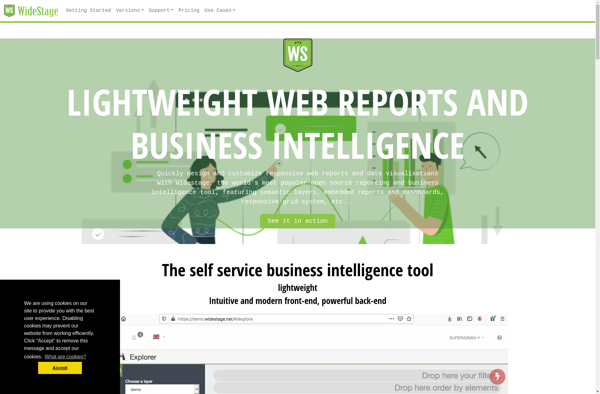
Widestage is an enterprise-grade platform for live video streaming, webinars, and webcasts. It enables businesses, event organizers, education institutions and media publishers to easily broadcast content in real-time to engage with their audience.Key features of Widestage include:Intuitive dashboards for managing live events, presenters, registration, and branding.Robust viewing portal allowing viewers...
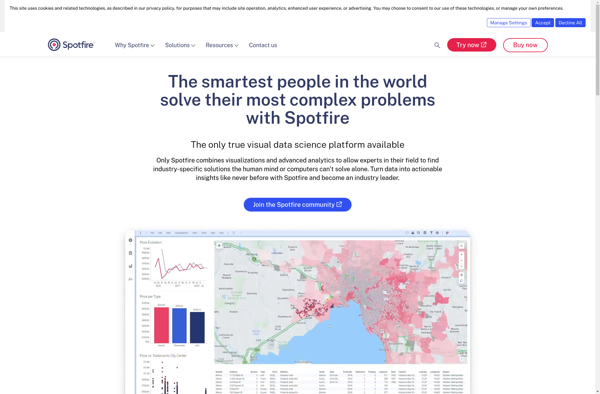
Spotfire is a business intelligence and analytics software platform designed for interactive data discovery and visualization. It enables rapid analysis of large, complex data sets to uncover deeper insights.Key features of Spotfire include:Interactive dashboards and visualizations - Drag-and-drop interface to create customized data visualizations like heat maps, charts, graphs, and...
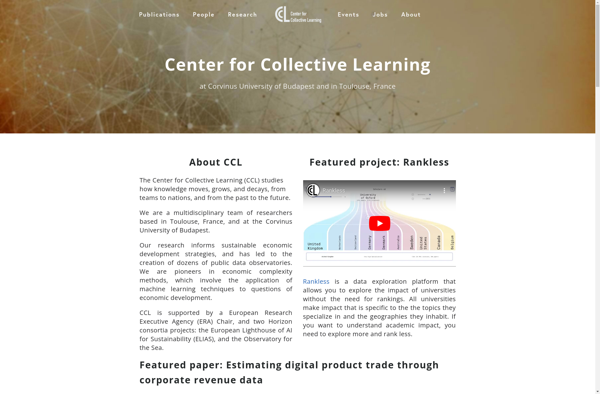
DIVE (Data Insight Visualization Explorer) is an open source web application developed by researchers at the MIT Media Lab. It is designed to enable interactive exploration and visualization of complex, multi-faceted datasets.Some key features of DIVE include:Intuitive drag-and-drop interface for rapidly building visualizations like maps, charts, graphs, and moreSupport for...
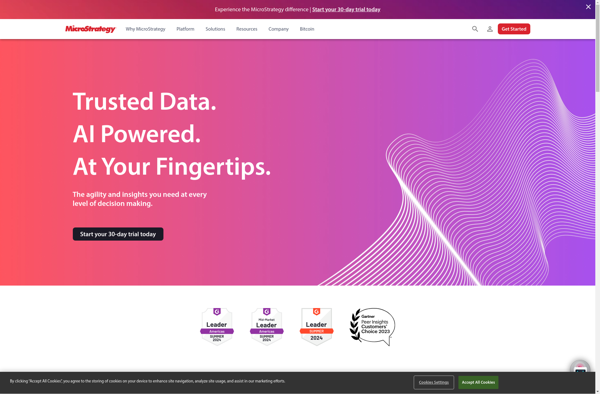
MicroStrategy is a leading enterprise analytics platform designed to help organizations make data-driven business decisions through advanced visualization and dashboarding capabilities. It serves as a one-stop solution for BI, allowing for data preparation, discovery, reporting, and predictive analytics.Key features of MicroStrategy include:Interactive dashboards and pixel-perfect reports that can be accessed...
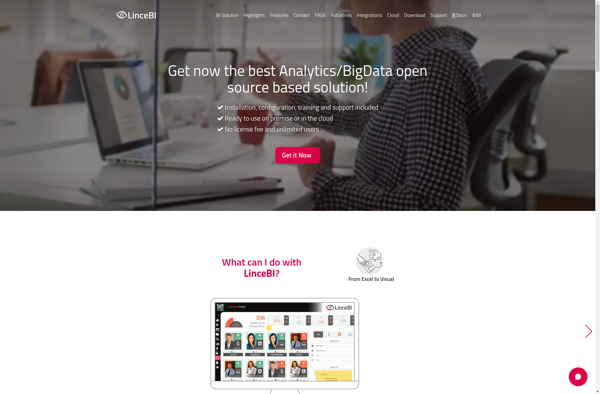
LinceBI is an open-source business intelligence and data visualization platform used to analyze and visualize data for better business insights. It provides an intuitive drag-and-drop interface to create interactive dashboards, reports, charts and graphs without the need for coding.Some key features of LinceBI include:Connectivity to multiple data sources such as...
Amazon QuickSight is a fast, cloud-powered business intelligence service that makes it easy to build visualizations, perform ad-hoc analysis, and quickly get business insights from your data. Some key features include:Intuitive visual interface that makes it easy to visualize and explore dataBroad data connectivity to connect to data sources like...
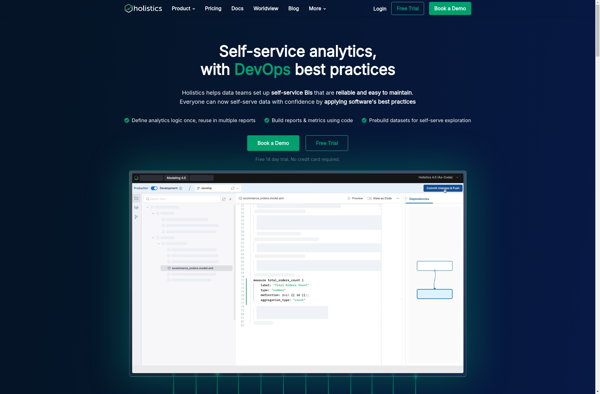
Holistics is an AI-powered unified data platform designed to help companies build and manage their data infrastructure. It provides an intuitive interface for data teams to ingest, prepare, analyze, and visualize data from diverse sources.Key capabilities include:Smart data collection and ingestion from databases, cloud apps, APIs etc.Automated data mapping, cleansing,...
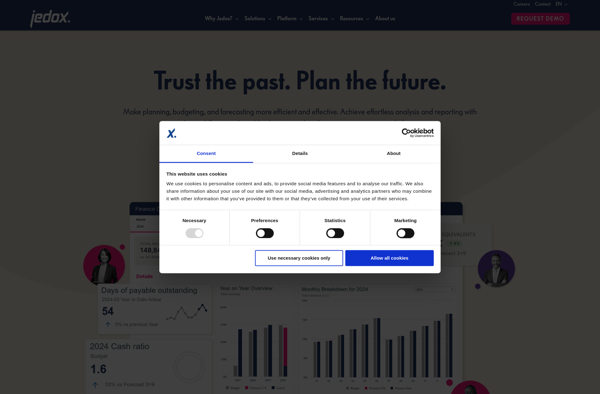
Jedox is a comprehensive business intelligence and corporate performance management platform designed for mid-size to large enterprises. It provides a wide range of capabilities including:Multi-dimensional online analytical processing (OLAP) for complex data analysis and modelingPlanning, budgeting, and forecasting features for financial planning and simulationCustomizable dashboards and self-service reporting for business...
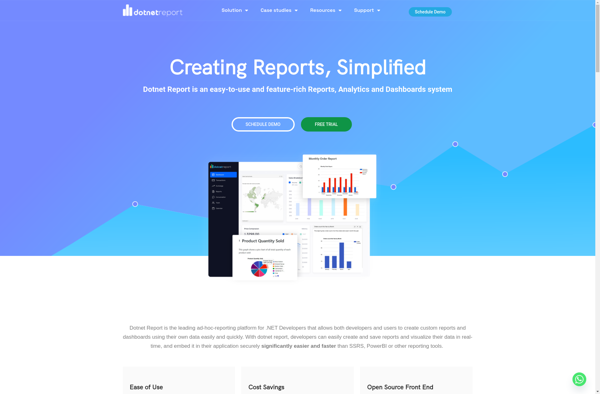
dotnet Report Builder is an open-source reporting tool designed specifically for .NET applications. It allows .NET developers to create rich, customizable reports for both web and desktop applications with minimal coding.Some key features of dotnet Report Builder include:Supports connecting to various data sources like SQL Server, Oracle, MongoDB, REST APIs,...
EZlytix is a business intelligence and data analytics software designed to help companies make data-driven decisions. It allows users to connect to various data sources, prepare and cleanse data, and create interactive dashboards and reports to gain insights.Some key features of EZlytix include:Intuitive drag-and-drop interface to build workflows, dashboards and...
QueryTree is a visual SQL analytics software designed to make query building fast and easy for any skill level. It features an intuitive drag-and-drop interface that allows users to construct complex SQL queries visually without typing code.Some key features of QueryTree include:Visual query builder with drag-and-drop fields and quick type...
ReportServer is an open source business intelligence and reporting platform used to create and distribute interactive reports and dashboards. It supports connecting to various relational and NoSQL databases, flat files, REST APIs, and other data sources to build reports.Some key capabilities and benefits of ReportServer include:Ad-hoc reporting for business users...
Knowi is a business intelligence and analytics software that provides tools for data visualization, reporting, and dashboard creation. It allows non-technical users to easily access, analyze, and visualize data without needing to know SQL or coding.Some key features of Knowi include:Drag-and-drop interface to build interactive dashboards, charts, reports and visualizationsBroad...
SpagoBI is an open-source business intelligence (BI) suite that provides a wide range of analytical and reporting capabilities for data analysis and visualization. It allows organizations to build interactive dashboards, reports, charts, widgets and what-if analysis to get valuable insights from their data.Some of the key features of SpagoBI include:Interactive...
FineReport is a business intelligence and reporting solution developed by FineReport Software Co., Ltd. It provides an intuitive drag-and-drop interface for report design, allowing users to easily create interactive and visually engaging reports, dashboards, and data visualizations.Some key features of FineReport include:Connectivity to a wide range of data sources like...
Knowage is an open-source business intelligence and data analytics platform. It provides a wide range of features for extracting insights from data, including:Interactive dashboards and reports for data visualizationAd-hoc reporting and analysisAdvanced data visualization with charts, graphs, and mapsData mining and OLAP analysisScorecards and KPI managementData integration from multiple sourcesResponsive...
Marple is an open-source, Markdown-based slide deck tool for creating presentations. It provides a minimalistic editor interface to write slide content in Markdown format, which then gets rendered into an elegant slide deck for presenting.Some key features of Marple:Write slide content in easy-to-read and write Markdown format. Format headings, lists,...
Chartrics is a powerful yet easy-to-use data visualization and analytics platform for creating interactive charts, graphs, and dashboards. With its intuitive drag-and-drop interface, anyone can quickly turn raw data into meaningful visualizations and share insights.Key features of Chartrics include:Import data from a variety of sources like CSVs, databases, and other...
Stagraph is a powerful yet easy-to-use data visualization and analytics platform designed for modern business needs. As a cloud-based solution, Stagraph enables users to effortlessly map, analyze, and gain actionable insights from even the most complex data sets through intuitive drag-and-drop visualizations.Key capabilities and benefits include:Intelligible and interactive data visualizations...
InfoCaptor Dashboard is a business intelligence and analytics platform designed to help companies consolidate their data, create customized dashboards and reports, and uncover valuable insights. Some key features of InfoCaptor Dashboard include:Data connectivity and ETL - Connect to data from multiple sources like SQL and NoSQL databases, cloud apps, Excel,...
Teradata is a leading enterprise data warehousing solution designed for large-scale data storage, management, and analysis. It leverages parallel processing and advanced database design to enable high-performance analytics on petabyte-scale data volumes.Some key capabilities and benefits of Teradata include:Massive scalability and storage capacity for storing hundreds of terabytes to petabytes...
DigDash Enterprise is a feature-rich business intelligence and analytics platform tailored for large enterprises. It enables organizations to aggregate data from multiple sources, gain actionable insights, and make data-driven decisions.Key capabilities include:Data connectivity - Connect to 100+ data sources such as databases, cloud apps, big data platforms, etc. Integrates nicely...
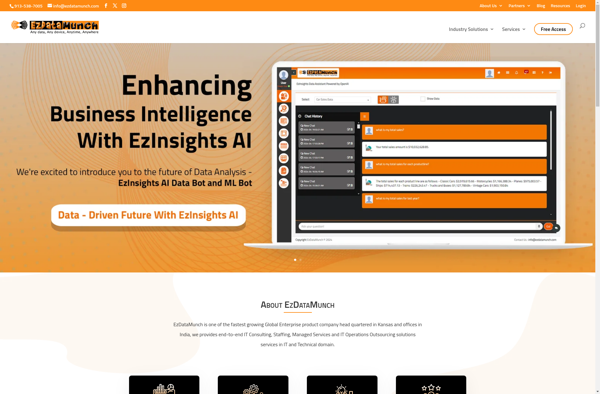
EzDataMunch is a no-code data preparation and analytics platform designed to empower anyone to work with data, regardless of technical skillset. It provides an easy-to-use graphical interface to combine, clean, enrich, and analyze data without the need to write any code.With EzDataMunch, you can connect to various data sources like...
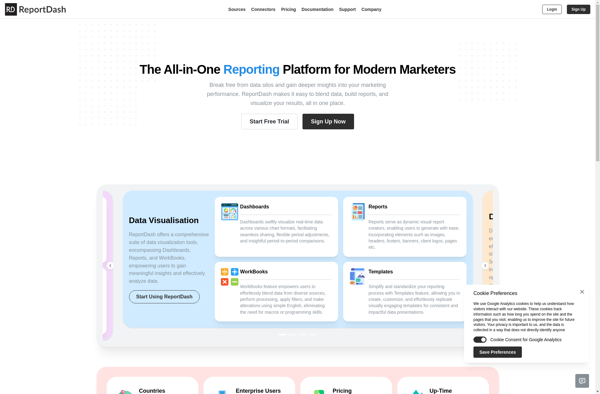
ReportDash is a versatile business intelligence and analytics platform suitable for companies of all sizes. It allows users to connect to various data sources, clean and transform data, and create interactive reports and dashboards that provide actionable insights.Key features include:Intuitive drag-and-drop interface to build reports and dashboards quicklyVariety of customizable...
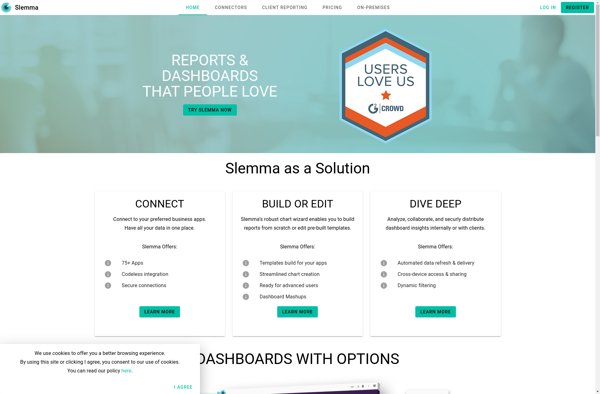
Slemma is an open-source alternative to Grammarly that provides AI-powered grammar and spelling correction for your writing.With Slemma, you can paste in any text and it will analyze it using natural language processing to find typos, grammatical mistakes, and other writing issues. As you type or edit text, Slemma underlines...
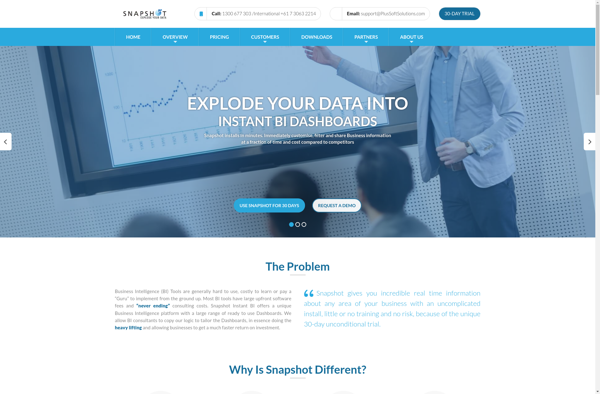
Snapshot BI is a business intelligence and analytics software designed specifically for small and medium-sized businesses. It provides an easy-to-use platform for companies to visualize, analyze, and gain actionable insights from their business data.Key features of Snapshot BI include:Interactive dashboards and reports - Create customized dashboards with drag-and-drop widgets to...
icStorm is an open-source, self-hosted agile project management application designed for small development teams. It offers similar core functionality as IceScrum, allowing teams to plan and track software projects using agile methodologies like Scrum and kanban.Key features of icStorm include:Customizable kanban boards to visualize workflow and track progressBacklogs for capturing...
Parrily is a cloud-based project management and team collaboration software designed specifically for agile development teams. It provides a variety of features to help manage projects, track progress, and facilitate teamwork:- Kanban boards - Visualize tasks and user stories on digital kanban boards. Move items through defined workflows to track...
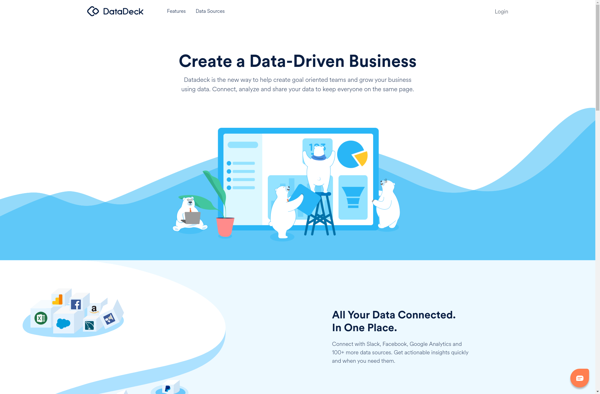
Datadeck is a business intelligence and data analytics platform designed to make working with data accessible for users of all technical skill levels. It provides an intuitive graphical interface that allows anyone to easily connect to data sources like databases, cloud apps, Excel, etc., and visualize and explore that data...
KiniMetrix is a cloud-based software platform designed for healthcare providers to help them better manage their practices, engage with patients, gain population health insights, and handle administrative tasks. It combines features typically found in separate electronic health record (EHR), practice management, patient portal and business intelligence solutions into one unified...
Birst is a cloud-native business intelligence and analytics platform used by enterprises to unify, understand, and act on data. Key capabilities and benefits include:Cloud data warehousing to bring together data from multiple sources for analysisInteractive dashboards and visualizations to spot trends and insightsSelf-service analytics empowering users across the organization to...
XLCubed is an Excel add-in designed specifically for financial analysts and modelers. It enhances Excel by providing commonly used financial functions, keyboard shortcuts, flexible graphing tools, and auditing features to improve model quality.Some of the key features of XLCubed include:Hundreds of financial and math functions like IRR, XNPV, XIRR, and...
Datawatch is a business intelligence and analytics platform designed for self-service data preparation, reporting and visualization. Some key capabilities and features of Datawatch include:Data Connectivity - Datawatch can connect to a wide variety of data sources like databases, applications, flat files, big data platforms and more. It provides connectivity to...
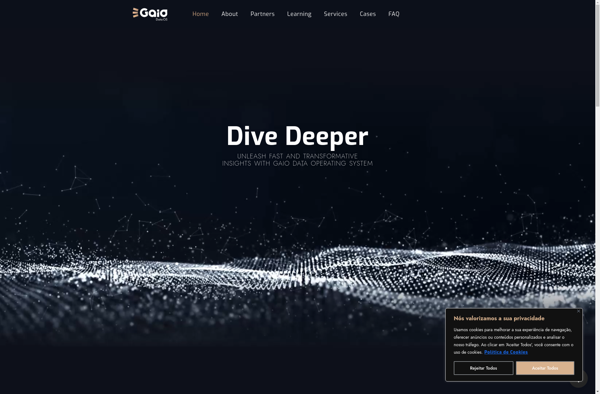
Gaio is an open-source monitoring and observability platform optimized for cloud-native infrastructure and applications. It provides comprehensive visibility into systems, services, and applications deployed in public, private, or hybrid cloud environments.Some key capabilities and benefits of Gaio include:Metrics - Ingest, process, store and visualize metrics from hosts, containers, services, and...
Dyntell Bi is a self-service business intelligence and data visualization software designed to help companies make data-driven decisions. It allows users to connect to a wide range of data sources including SQL databases, cloud apps, and Excel files to import data.Once the data is imported, Dyntell Bi provides an intuitive...
Cortana Analytics is an integrated suite of intelligence tools and services from Microsoft designed to help organizations make data-driven decisions. It includes the following core components:Azure Machine Learning - A cloud service for building and deploying predictive analytics solutions and machine learning modelsHDInsight - Managed Hadoop, Spark, and other big...
Bime is a flexible business intelligence and analytics platform suitable for modern data teams. It provides an easy way to connect to various data sources like databases, cloud apps, and business software to build interactive dashboards, reports, and analytics.Some key capabilities and benefits of Bime include:Intuitive drag-and-drop interface to visualize...
GoodData is a business intelligence and analytics platform used by companies to collect, store, and analyze their data to drive business decisions. Some key capabilities and features of GoodData include:Data warehousing and ETL - GoodData ingests data from various sources, transforms it, and loads it into a cloud data warehouse...
VizualSurvey is a powerful yet easy-to-use online survey creator that empowers users of all skill levels to make professional surveys in minutes. With its intuitive drag-and-drop builder and variety of customizable themes, even beginners can design great-looking online forms tailored to their needs.Some key features of VizualSurvey include:Drag-and-drop survey builder...
Salford Systems is a San Diego-based software company founded in 1983 that develops advanced analytics and data mining software. Their main products include:CART - classification and regression tree algorithm softwareMARS - multivariate adaptive regression splines modelingTreeNet - stochastic gradient boosting and random forestsRandom Forests - ensemble learning method for classification...
Analyza is a business intelligence and data analytics software platform designed to help companies make data-driven decisions. It provides tools for data preparation, interactive visualization, dashboarding, reporting, and predictive analytics.Key features of Analyza include:Intuitive drag-and-drop interface for building dashboards and reports without codingHundreds of customizable data visualization options including charts,...
Oracle Business Indicators is a robust business intelligence and analytics solution from Oracle. It enables organizations to track key performance indicators (KPIs), create interactive dashboards, and generate insightful reports to monitor performance and identify issues and opportunities.Key features of Oracle Business Indicators include:Pre-built KPIs and dashboards for all business functions...
Prognoz is a comprehensive business forecasting and predictive analytics platform designed to help organizations improve forecast accuracy and operational efficiency. It leverages sophisticated artificial intelligence algorithms, time series analysis, simulation modeling, and machine learning techniques to uncover patterns in historical data and generate accurate demand forecasts.Key features of Prognoz include:Intuitive...
Alpine Data Labs is an end-to-end predictive analytics platform designed for data science teams to build and deploy predictive models. It aims to make advanced analytics more accessible and collaborative.Key features of Alpine Data Labs include:Intuitive graphical interface for loading data from various sources, cleaning and munging data, exploring relationships,...
Centius Qi is an intuitive, code-free business automation platform powered by artificial intelligence. It helps companies eliminate manual processes, automate repetitive tasks, and streamline workflows across the organization.With an easy-to-use drag and drop interface, Centius allows anyone to build workflows, set up integrations, create intelligent chatbots, gather actionable insights from...
Progress OpenEdge is a development platform optimized for creating business applications. It includes a 4th generation programming language (4GL) designed for rapid application development along with tools for building user interfaces, reporting, integration, and application management.Key features of Progress OpenEdge include:4GL language for faster coding and reduced maintenance costs compared...
Soley Studio is an open-source modeling tool for creating UML diagrams and Business Process Model and Notation (BPMN) workflows. It provides a comprehensive environment for software design and business process modeling.With its simple and intuitive graphical interface, Soley Studio makes it easy to build various diagrams such as use case...
Owlata is a customer data platform (CDP) and marketing automation software designed to help B2C companies collect customer data from all touchpoints, build unified customer profiles, derive actionable insights, and orchestrate personalized omnichannel campaigns.Key capabilities and benefits include:Unified Customer Profiles - Consolidate customer data from all online and offline sources...
Jolicharts is a feature-rich JavaScript charting library that allows you to easily add interactive charts and graphs to web applications and dashboards. With Jolicharts, you can create over 30 types of charts including line charts, bar charts, pie charts, scatter plots, stacked bar charts and more.Some key features of Jolicharts...
KPI Watchdog is a robust business intelligence and data analytics platform designed to help companies track, analyze, and visualize key performance indicators (KPIs) in real-time. It provides powerful, customizable dashboards and reporting tools to monitor essential metrics across all departments and roles.With KPI Watchdog, businesses can connect data from multiple...
SQLwallet is an open-source SQL database engine built with a focus on security, encryption, and privacy. Developed by a team of database experts and cryptographers, SQLwallet aims to make handling confidential user data easier for developers.Some key features of SQLwallet include:End-to-end encryption for data at rest and in transitFine-grained access...
Palo Alto Networks' Palo Suite is an integrated platform that delivers a broad range of cybersecurity capabilities for enterprises. It brings together network security, cloud security, advanced threat prevention, and more into a single offering.At the core of Palo Suite is the company's next-generation firewalls, which provide granular visibility and...
Bouquet is an open-source and free office suite that provides alternatives to Microsoft Office apps like Word, Excel, and PowerPoint. It includes a word processor, spreadsheet program, and presentation software that allows users to create, edit, and share documents, spreadsheets, and slide decks.The word processor, Bouquet Words, provides similar functionality...
Kubit is an open-source, self-hosted alternative to Trello for agile and kanban-style project management. Here is an overview of its key features and capabilities:- Create boards to represent projects, with flexible columns for tracking workflow. Common columns include Backlog, To Do, In Progress, Testing, Done.- Within each board, add customizable...
Bilbeo Analytics is a leading web analytics software designed to help businesses understand customer behavior and optimize conversion rates. It provides in-depth analysis through interactive dashboards, reports, and visualizations of key metrics like traffic sources, page views, conversions, and more.Some key features of Bilbeo Analytics include:Customizable dashboards - Build interactive...
Pyramid Analytics is an advanced business intelligence and analytics platform designed to empower organizations to make faster, more informed decisions. It combines governed self-service analytics capabilities with artificial intelligence-powered features to enable employees to easily access, explore, and act on governed data.Key capabilities of Pyramid Analytics include:Unified governed self-service analytics...