Datadeck is a data analytics and business intelligence platform designed for ease of use. It allows users of all skill levels to connect data from various sources, visualize and explore it, and build dashboards and reports without coding.
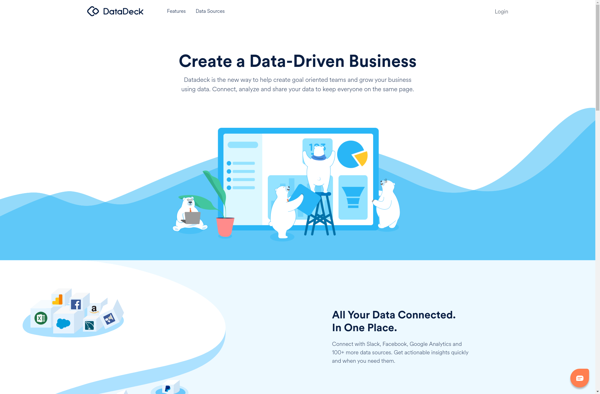
Datadeck: Data Analytics & Business Intelligence Platform
A user-friendly platform for easy data connection, visualization, and reporting, built for users of all skill levels
What is Datadeck?
Datadeck is a business intelligence and data analytics platform designed to make working with data accessible for users of all technical skill levels. It provides an intuitive graphical interface that allows anyone to easily connect to data sources like databases, cloud apps, Excel, etc., and visualize and explore that data through interactive dashboards, charts, pivot tables, and more.
Key features and benefits of Datadeck include:
No-code interface - Users can intuitively build reports, dashboards, charts without needing to know SQL, coding, etc.
Drag-and-drop functionality for rapidly analyzing data
Pre-built connectors for cloud apps, databases, file storage, allowing users to quickly connect their data sources
Interactive visualizations empower business users to easily explore and understand their data
Collaboration features like sharing dashboards and annotations allow teams to discuss insights
Scheduled reports and exports help automate delivery of insights
Role-based access control and enterprise-grade security to protect sensitive data
With its emphasis on usability and visual data exploration, Datadeck makes it easy for all business teams - from sales and marketing to operations and finance - to harness company data to drive better decision making. The no code interface allows faster time-to-insight even for non-technical users compared to traditional BI tools.
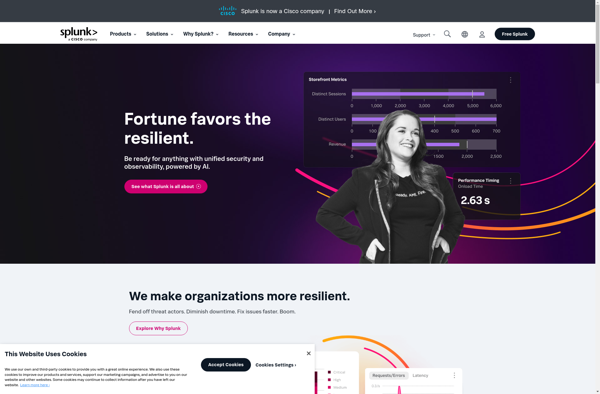
Splunk is a software platform that enables users to search, analyze, and visualize the data gathered from the infrastructure, systems, and applications of an organization. It captures, indexes, and correlates real-time data in a searchable repository from which it can generate graphs, reports, alerts, dashboards, and visualizations.Some key features and...
Google Analytics is a free web analytics service offered by Google that tracks and reports website traffic. It is the most widely used web analytics service on the Internet.Some key features of Google Analytics include:Tracking number of visitors, page views, bounce rate, session duration, demographics, location, behavior and moreIn-depth analysis...
Tableau is a leading business intelligence and data visualization platform used by organizations of all sizes to transform their data into easy-to-understand visualizations and dashboards. With Tableau, users can connect to a wide range of data sources, prepare and clean the data for analysis, and create interactive data visualizations such...
QlikView is a business intelligence and data visualization platform used to create interactive dashboards and analytics applications. It was first released in 1993 by the Swedish company Qlik. Key features of QlikView include:Associative data modeling and in-memory analytics engine - Allows fast analysis of large, disparate datasets without predefined schema...
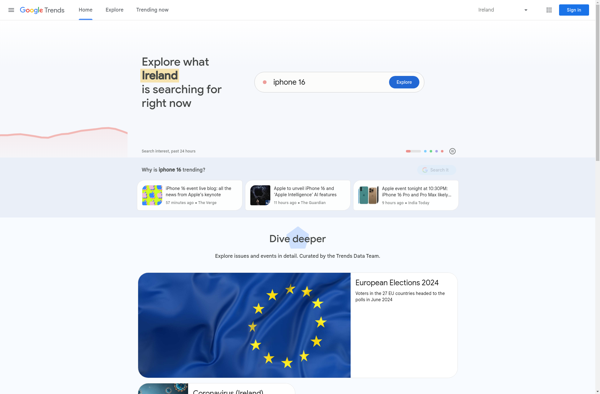
Google Trends is a website by Google that analyzes the popularity of top search queries in Google Search across various regions and languages. It offers data and visualizations showing how frequently particular search terms are entered relative to total search volume over given time periods.Users can enter up to five...
Wikidata is a free and open knowledge base that can be read and edited by both humans and machines. It acts as central storage for the structured data of its Wikimedia sister projects including Wikipedia, Wikivoyage, Wiktionary, Wikisource, and others.Launched in 2012, Wikidata contains over 90 million data items spanning...
Marple is an open-source, Markdown-based slide deck tool for creating presentations. It provides a minimalistic editor interface to write slide content in Markdown format, which then gets rendered into an elegant slide deck for presenting.Some key features of Marple:Write slide content in easy-to-read and write Markdown format. Format headings, lists,...
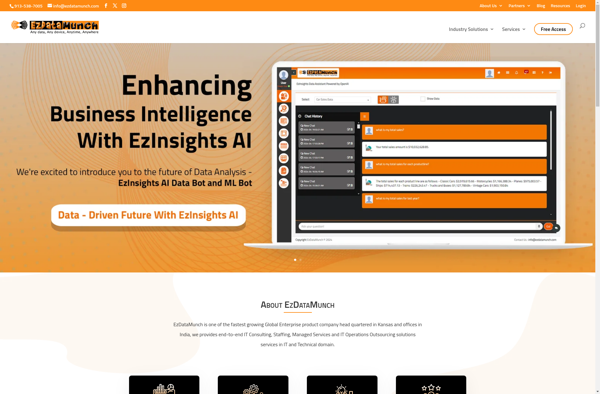
EzDataMunch is a no-code data preparation and analytics platform designed to empower anyone to work with data, regardless of technical skillset. It provides an easy-to-use graphical interface to combine, clean, enrich, and analyze data without the need to write any code.With EzDataMunch, you can connect to various data sources like...
Open Web Analytics (OWA) is an open source web analytics platform that you can use to track and analyze traffic on your websites. It provides a wealth of data to help you understand your visitors and make better decisions about your online marketing and content strategy.Some key features of OWA...
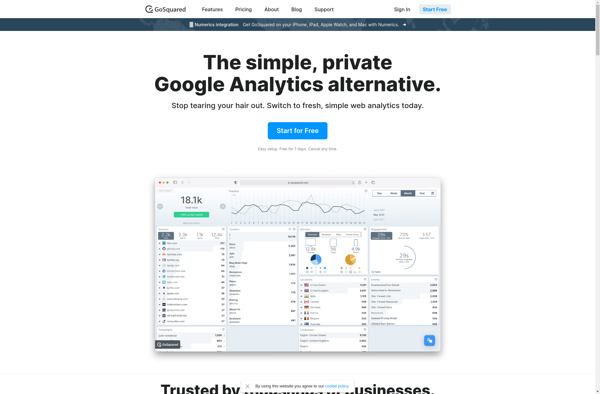
GoSquared is a real-time web analytics platform used to understand visitor behavior on websites and apps. It provides real-time analytics to view current visitors on your site, see where they came from, what they're doing, and more.Some key features of GoSquared include:Live visitor monitoring - See every visitor on your...