EzDataMunch
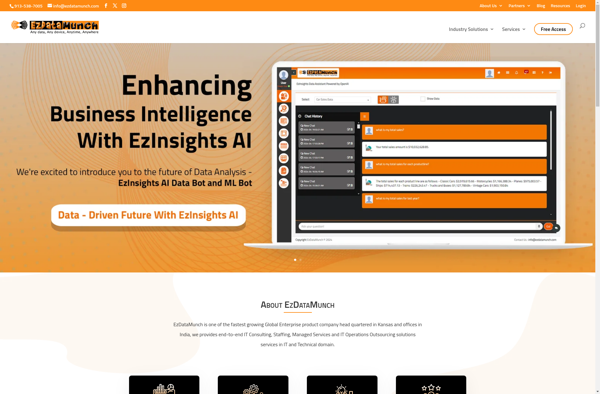
EzDataMunch: No-Code Data Preparation & Analytics
EzDataMunch is a no-code data preparation and analytics platform that allows anyone to easily combine, clean, enrich and analyze data without writing code. It has an intuitive drag-and-drop interface to transform data and generate insights.
What is EzDataMunch?
EzDataMunch is a no-code data preparation and analytics platform designed to empower anyone to work with data, regardless of technical skillset. It provides an easy-to-use graphical interface to combine, clean, enrich, and analyze data without the need to write any code.
With EzDataMunch, you can connect to various data sources like databases, cloud apps, APIs, files, and more to import data. It has over 300 pre-built transformations and enrichments to prepare the data, including operations like concatenate, normalize, standardize, parse, merge, aggregate, lookup enrichment, and more. The platform allows you to visually build data pipelines with a simple drag-and-drop interface to transform raw data into analysis-ready datasets.
Once the data is prepared, EzDataMunch allows you to analyze it right within the platform. It includes powerful analytics and visualization capabilities such as pivot tables, charts, aggregations, and statistical analysis without requiring expertise in BI tools. The dashboards and reports can be shared with others or exported into files, apps, and portals via embed codes.
EzDataMunch aims to make data accessible for decision making to every employee in an organization. Its code-free environment and intuitive interface eliminates the technical barriers to working with data. With EzDataMunch, anyone ranging from analysts, managers, and executives can prep, analyze, and act on data independently without being dependent on technical teams.
EzDataMunch Features
Features
- Drag-and-drop data transformation
- No-code data preparation
- Data cleaning and enrichment
- Intuitive user interface
- Data analysis and reporting
- Collaboration and sharing
Pricing
- Freemium
- Subscription-Based
Pros
Cons
Official Links
Reviews & Ratings
Login to ReviewThe Best EzDataMunch Alternatives
View all EzDataMunch alternatives with detailed comparison →
Top Ai Tools & Services and Data Analytics and other similar apps like EzDataMunch
Here are some alternatives to EzDataMunch:
Suggest an alternative ❐Microsoft Power BI

Tableau

QlikView

Sisense

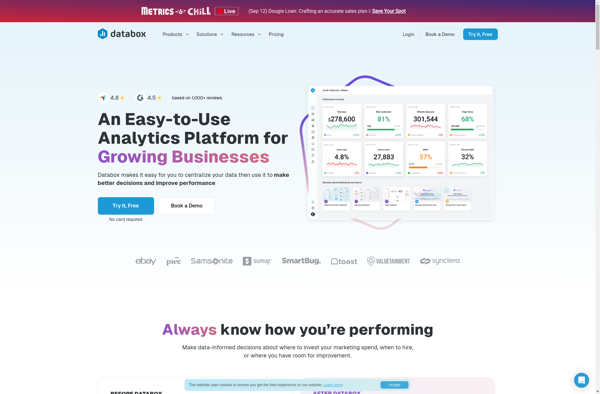
Databox
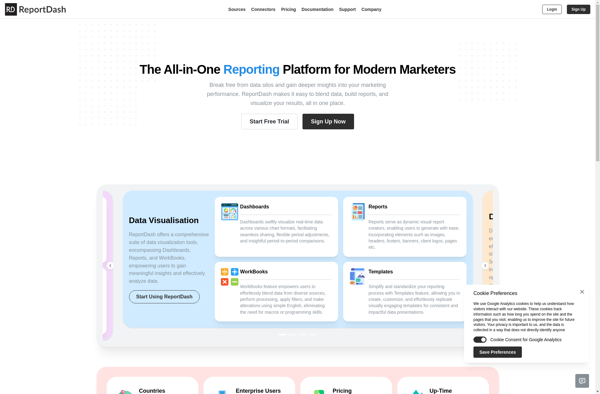
ReportDash
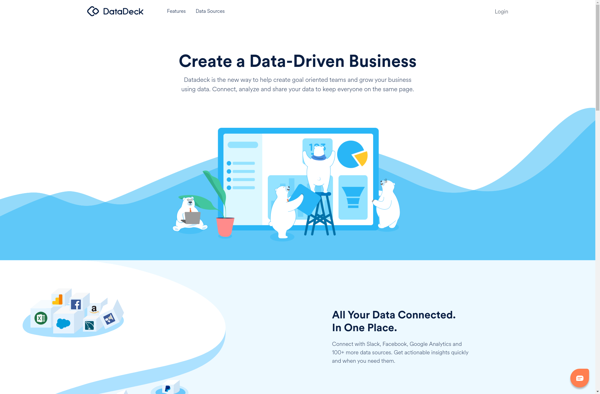
Datadeck