Analyza
Analyza is a business intelligence and data analytics platform that allows users to visualize, explore, and analyze data to gain actionable insights. It has drag-and-drop dashboard building, interactive reporting, predictive modeling, and data preparation capabilities.
Analyza: Business Intelligence & Data Analytics Platform
A powerful platform for data visualization, exploration, and analysis, with drag-and-drop dashboard building, interactive reporting, predictive modeling, and data preparation capabilities.
What is Analyza?
Analyza is a business intelligence and data analytics software platform designed to help companies make data-driven decisions. It provides tools for data preparation, interactive visualization, dashboarding, reporting, and predictive analytics.
Key features of Analyza include:
- Intuitive drag-and-drop interface for building dashboards and reports without coding
- Hundreds of customizable data visualization options including charts, graphs, gauges, maps, and more
- Interactive reporting functionality such as drilling, pivoting, filtering, and sorting
- AI-powered predictive modeling and forecasting capabilities
- Data integration from multiple sources including databases, cloud apps, files, etc.
- Collaborative analytics with real-time dashboard sharing and annotated discussions
- Flexible deployment options - cloud-based or on-premises
- Granular security permissions and data governance controls
- APIs and embeddable analytics for custom applications
- Mobile optimization for viewing and interacting with analytics on the go
With robust analytics capabilities, flexible deployment, and an easy-to-use interface, Analyza provides valuable and actionable business insights.
Analyza Features
Features
- Drag-and-drop dashboard builder
- Interactive data visualization
- Predictive analytics and machine learning
- Data preparation and ETL
- Collaboration tools
- Mobile app for data access on the go
Pricing
- Freemium
- Subscription-Based
Pros
Intuitive and easy to use interface
Powerful data analytics capabilities
Flexible pricing options
Scales to large data sets
Integrates with many data sources
Cons
Steep learning curve for advanced features
Limited customization compared to open-source options
Requires technical resources for complex deployments
Official Links
Reviews & Ratings
Login to ReviewThe Best Analyza Alternatives
View all Analyza alternatives with detailed comparison →
Top Business & Commerce and Business Intelligence and other similar apps like Analyza
Here are some alternatives to Analyza:
Suggest an alternative ❐Tableau
Tableau is a leading business intelligence and data visualization platform used by organizations of all sizes to transform their data into easy-to-understand visualizations and dashboards. With Tableau, users can connect to a wide range of data sources, prepare and clean the data for analysis, and create interactive data visualizations such...

QlikView
QlikView is a business intelligence and data visualization platform used to create interactive dashboards and analytics applications. It was first released in 1993 by the Swedish company Qlik. Key features of QlikView include:Associative data modeling and in-memory analytics engine - Allows fast analysis of large, disparate datasets without predefined schema...

Pentaho
Pentaho is a comprehensive open source business intelligence (BI) suite that provides a range of data integration, analytics, visualization, reporting, data mining, and workflow capabilities. It is designed to help businesses consolidate data from disparate sources for unified analytics and reporting.Some of the key capabilities and components of Pentaho include:Data...

SAP BusinessObjects
SAP BusinessObjects is a comprehensive business intelligence and analytics software suite from SAP. It brings together capabilities for reporting, analysis, dashboards, data visualization, data discovery, and more to help organizations unlock value from their data.Key capabilities and components of SAP BusinessObjects include:Centralized semantic layer for consistent data across the organizationPowerful...

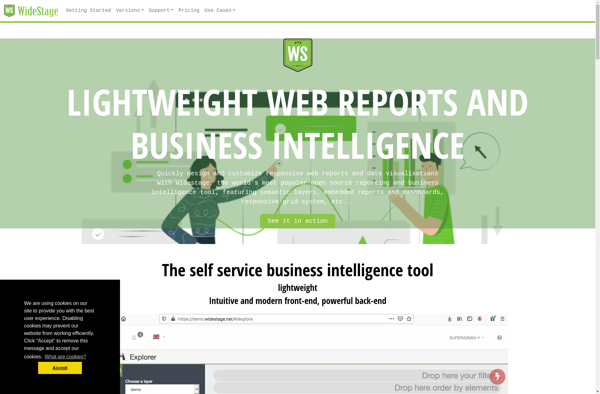
Widestage
Widestage is an enterprise-grade platform for live video streaming, webinars, and webcasts. It enables businesses, event organizers, education institutions and media publishers to easily broadcast content in real-time to engage with their audience.Key features of Widestage include:Intuitive dashboards for managing live events, presenters, registration, and branding.Robust viewing portal allowing viewers...
Sisense
Sisense is a business intelligence and data analytics software platform designed to help non-technical users prepare, analyze and visualize complex data. Some key features of Sisense include:Intuitive drag-and-drop interface for building interactive dashboards and visualizations like charts, graphs and pivot tables without coding.Ability to connect to wide variety of data...

Amazon QuickSight
Amazon QuickSight is a fast, cloud-powered business intelligence service that makes it easy to build visualizations, perform ad-hoc analysis, and quickly get business insights from your data. Some key features include:Intuitive visual interface that makes it easy to visualize and explore dataBroad data connectivity to connect to data sources like...

QueryTree
QueryTree is a visual SQL analytics software designed to make query building fast and easy for any skill level. It features an intuitive drag-and-drop interface that allows users to construct complex SQL queries visually without typing code.Some key features of QueryTree include:Visual query builder with drag-and-drop fields and quick type...

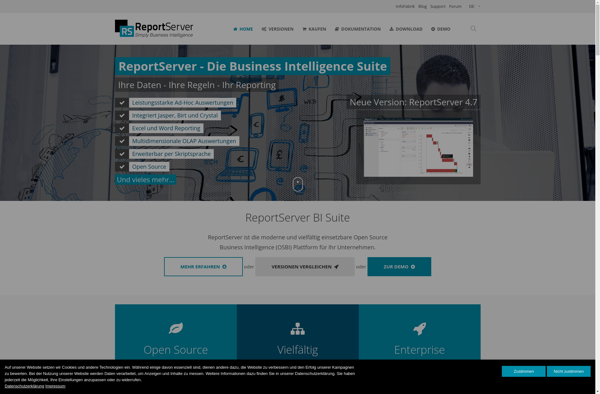
ReportServer
ReportServer is an open source business intelligence and reporting platform used to create and distribute interactive reports and dashboards. It supports connecting to various relational and NoSQL databases, flat files, REST APIs, and other data sources to build reports.Some key capabilities and benefits of ReportServer include:Ad-hoc reporting for business users...
Marple
Marple is an open-source, Markdown-based slide deck tool for creating presentations. It provides a minimalistic editor interface to write slide content in Markdown format, which then gets rendered into an elegant slide deck for presenting.Some key features of Marple:Write slide content in easy-to-read and write Markdown format. Format headings, lists,...

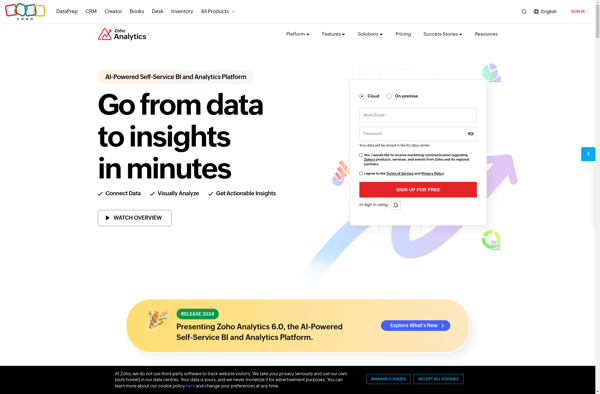
Zoho Analytics
Zoho Analytics is a powerful yet user-friendly business intelligence and data analytics platform used by organizations of all sizes. It allows you to connect data from multiple sources including databases, cloud apps, and files, enabling a unified view of business data.With an intuitive drag-and-drop interface, Zoho Analytics makes it easy...
Stagraph
Stagraph is a powerful yet easy-to-use data visualization and analytics platform designed for modern business needs. As a cloud-based solution, Stagraph enables users to effortlessly map, analyze, and gain actionable insights from even the most complex data sets through intuitive drag-and-drop visualizations.Key capabilities and benefits include:Intelligible and interactive data visualizations...

Phrazor
Phrazor is a cloud-based plagiarism detection software designed for educational institutions. It allows teachers and administrators to check student submissions such as essays, reports, code, and more for plagiarism by comparing the content against its extensive database of web sources as well as previously submitted student work.Some key features of...
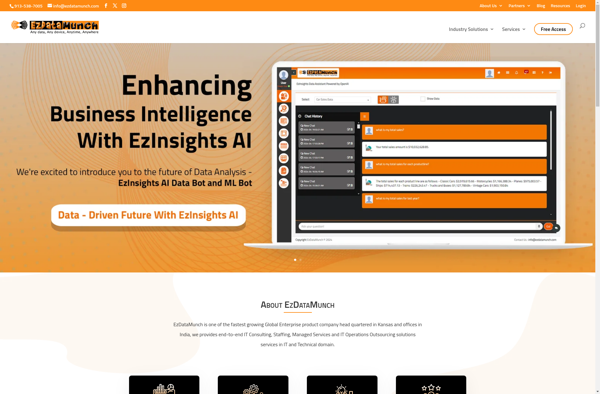
EzDataMunch
EzDataMunch is a no-code data preparation and analytics platform designed to empower anyone to work with data, regardless of technical skillset. It provides an easy-to-use graphical interface to combine, clean, enrich, and analyze data without the need to write any code.With EzDataMunch, you can connect to various data sources like...