SAP BusinessObjects is a business intelligence and analytics software suite that helps organizations collect, organize, analyze, visualize, and share data. It offers reporting, dashboards, visualization, and data discovery capabilities.
SAP BusinessObjects: Business Intelligence and Analytics Software
SAP BusinessObjects is a business intelligence and analytics software suite that helps organizations collect, organize, analyze, visualize, and share data. It offers reporting, dashboards, visualization, and data discovery capabilities.
What is SAP BusinessObjects?
SAP BusinessObjects is a comprehensive business intelligence and analytics software suite from SAP. It brings together capabilities for reporting, analysis, dashboards, data visualization, data discovery, and more to help organizations unlock value from their data.
Key capabilities and components of SAP BusinessObjects include:
Centralized semantic layer for consistent data across the organization
Powerful reporting engine with pixel-perfect formatting and multi-pass calculations
Interactive dashboards with alerts, annotations, filtering, and more
Data discovery for self-service data preparation, blending, and visualization
Predictive analytics, planning, and data mining capabilities
Strong security features and governance
Broad platform support and enterprise scalability
SAP BusinessObjects helps business users across all levels of an organization to access, analyze, and share trusted data for faster and better decision making. With its centralized semantic layer, it provides a single version of truth. The suite integrates with both SAP and non-SAP data sources.
Overall, SAP BusinessObjects is an enterprise business intelligence standard used by organizations across industries worldwide looking to optimize their business performance.
Tableau is a leading business intelligence and data visualization platform used by organizations of all sizes to transform their data into easy-to-understand visualizations and dashboards. With Tableau, users can connect to a wide range of data sources, prepare and clean the data for analysis, and create interactive data visualizations such...
QlikView is a business intelligence and data visualization platform used to create interactive dashboards and analytics applications. It was first released in 1993 by the Swedish company Qlik. Key features of QlikView include:Associative data modeling and in-memory analytics engine - Allows fast analysis of large, disparate datasets without predefined schema...
Pentaho is a comprehensive open source business intelligence (BI) suite that provides a range of data integration, analytics, visualization, reporting, data mining, and workflow capabilities. It is designed to help businesses consolidate data from disparate sources for unified analytics and reporting.Some of the key capabilities and components of Pentaho include:Data...
Snapboard is an online visual collaboration software used by teams for brainstorming, organizing workflows, managing projects, and more. It provides an infinite virtual whiteboard where users can add sticky notes, images, freehand drawings, and diagrams to capture ideas and map out plans.Key features of Snapboard include:Infinite canvas for adding unlimited...
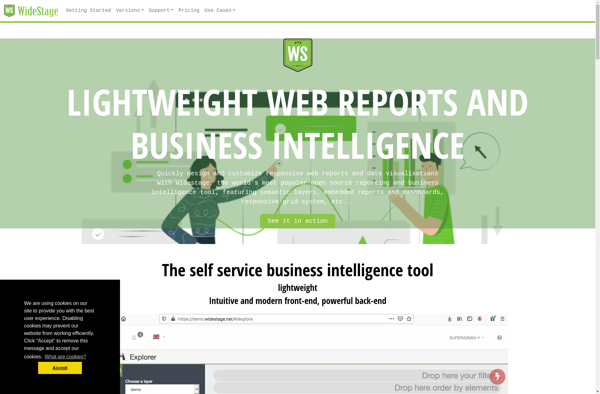
Widestage is an enterprise-grade platform for live video streaming, webinars, and webcasts. It enables businesses, event organizers, education institutions and media publishers to easily broadcast content in real-time to engage with their audience.Key features of Widestage include:Intuitive dashboards for managing live events, presenters, registration, and branding.Robust viewing portal allowing viewers...
D3.js, or D3, is an open-source JavaScript library used for visualizing data with web standards. D3 stands for Data-Driven Documents. It allows developers to bind arbitrary data to the Document Object Model (DOM) and then apply data-driven transformations to the document. This allows web developers to create dynamic, interactive data...
Redash is an open-source business intelligence and data visualization web application. It allows users to connect to multiple data sources including SQL databases, query and visualize the data, and create interactive dashboards to share insights.Some key features of Redash:Connect to data sources like PostgreSQL, MySQL, SQL Server, Redshift, BigQuery and...
Amazon QuickSight is a fast, cloud-powered business intelligence service that makes it easy to build visualizations, perform ad-hoc analysis, and quickly get business insights from your data. Some key features include:Intuitive visual interface that makes it easy to visualize and explore dataBroad data connectivity to connect to data sources like...
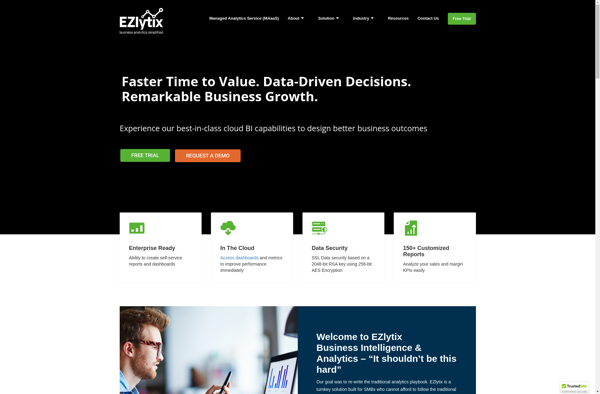
EZlytix is a business intelligence and data analytics software designed to help companies make data-driven decisions. It allows users to connect to various data sources, prepare and cleanse data, and create interactive dashboards and reports to gain insights.Some key features of EZlytix include:Intuitive drag-and-drop interface to build workflows, dashboards and...
QueryTree is a visual SQL analytics software designed to make query building fast and easy for any skill level. It features an intuitive drag-and-drop interface that allows users to construct complex SQL queries visually without typing code.Some key features of QueryTree include:Visual query builder with drag-and-drop fields and quick type...
Keeeb is an open-source, keyboard-focused note taking and productivity app for Windows, Mac and Linux operating systems. It is designed specifically for power users who prefer to use keyboard shortcuts over reaching for the mouse.Some of the key features of Keeeb include:Quick note taking - easily capture thoughts, notes, web...
Angoss KnowledgeSEEKER is a comprehensive data mining and predictive analytics platform used to uncover patterns and relationships in data to improve decision making. It helps organizations leverage their data by providing capabilities for:Data preparation and cleansing - KnowledgeSEEKER provides tools to profile, cleanse, transform, aggregate, sample, and partition data to...
Marple is an open-source, Markdown-based slide deck tool for creating presentations. It provides a minimalistic editor interface to write slide content in Markdown format, which then gets rendered into an elegant slide deck for presenting.Some key features of Marple:Write slide content in easy-to-read and write Markdown format. Format headings, lists,...
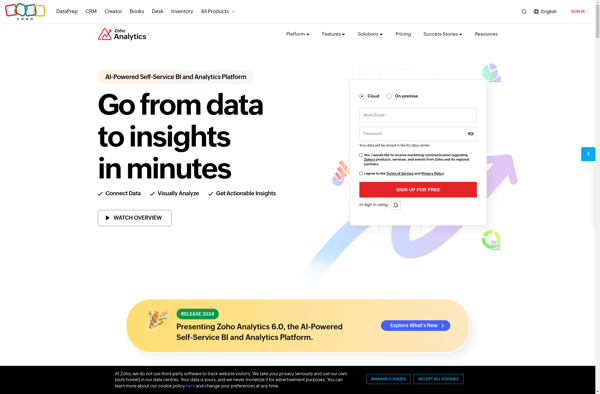
Zoho Analytics is a powerful yet user-friendly business intelligence and data analytics platform used by organizations of all sizes. It allows you to connect data from multiple sources including databases, cloud apps, and files, enabling a unified view of business data.With an intuitive drag-and-drop interface, Zoho Analytics makes it easy...
Dyntell Bi is a self-service business intelligence and data visualization software designed to help companies make data-driven decisions. It allows users to connect to a wide range of data sources including SQL databases, cloud apps, and Excel files to import data.Once the data is imported, Dyntell Bi provides an intuitive...
Analyza is a business intelligence and data analytics software platform designed to help companies make data-driven decisions. It provides tools for data preparation, interactive visualization, dashboarding, reporting, and predictive analytics.Key features of Analyza include:Intuitive drag-and-drop interface for building dashboards and reports without codingHundreds of customizable data visualization options including charts,...
Mantle Enterprise Analytics is a robust business intelligence and analytics solution catered towards large enterprises. It provides a wide range of capabilities to collect, store, process, analyze, and visualize data across the organization.Key features include:Interactive dashboards and reports for data visualizationPredictive modeling, forecasting, and machine learning algorithmsConnectors to extract data...
AnyChart is a feature-rich JavaScript charting library that enables developers to easily add interactive charts and dashboards to web and mobile applications. With its lightweight architecture, AnyChart aims to provide high performance chart rendering optimized even for large datasets.AnyChart supports over 80 chart types including column, bar, line, area, pie,...