Snapboard is a visual collaboration software that allows teams to brainstorm ideas, organize workflows, and manage projects on an online whiteboard. It includes infinite canvas, sticky notes, freehand drawing tools, and integrates with various apps.
Brainstorm ideas, organize workflows, and manage projects on an online whiteboard with Snapboard, a visual collaboration software that includes infinite canvas, sticky notes, freehand drawing tools, and integrates with various apps.
What is Snapboard?
Snapboard is an online visual collaboration software used by teams for brainstorming, organizing workflows, managing projects, and more. It provides an infinite virtual whiteboard where users can add sticky notes, images, freehand drawings, and diagrams to capture ideas and map out plans.
Key features of Snapboard include:
Infinite canvas for adding unlimited notes, files, drawings across multiple whiteboards
Virtual sticky notes in various colors and sizes for capturing ideas
Freehand drawing tools for diagrams, wireframes, illustrations
Image uploads and screenshots
Comments and voting on notes to prioritize ideas
Integrates with cloud storage, task apps, calendars
Real-time collaboration allows multiple people to edit whiteboards together
Reusable templates for agile frameworks like Lean and Kanban
Snapboard helps teams brainstorm concepts visually, outline goals and workflows for projects, collect feedback and input from team members, and keep everyone aligned. Its infinite canvas and integrations make it easy to organize any amount of ideas, content, and plans in flexible, visual workspaces.
Grafana is a feature-rich, open source analytics and monitoring visualization suite. It integrates tightly with a variety of database technologies like Graphite, Prometheus, InfluxDB, Elasticsearch, and more to allow for easy exploration and visualization of time series data. Some key capabilities and benefits of Grafana include:Intuitive graphical UI makes it...
Microsoft Power BI is a powerful business analytics service developed by Microsoft. It empowers users to transform raw data into meaningful insights, create interactive reports and dashboards, and share data-driven stories within an organization. Power BI is designed to help businesses and individuals make informed decisions based on a comprehensive...
Tableau is a leading business intelligence and data visualization platform used by organizations of all sizes to transform their data into easy-to-understand visualizations and dashboards. With Tableau, users can connect to a wide range of data sources, prepare and clean the data for analysis, and create interactive data visualizations such...
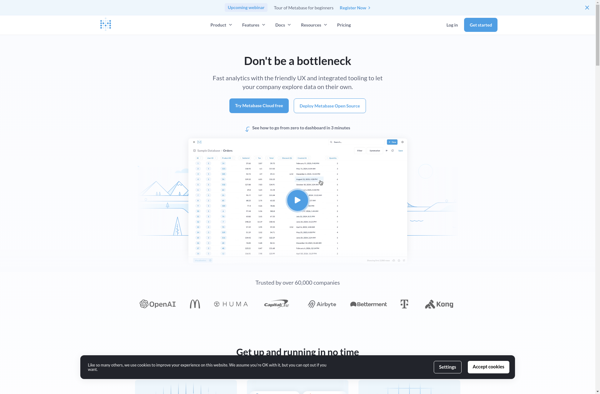
Metabase is an open source business intelligence platform and analytics tool. It allows anyone on a team to ask questions about their data, explore it, and share insights with others through easy-to-create dashboards, charts, and visualizations. Metabase provides an intuitive frontend interface so users can get answers and discover trends...
Looker Studio is a business intelligence and analytics platform designed to help companies analyze data and gain valuable insights. It provides an intuitive, web-based interface that enables users without technical skills to explore, visualize and share data easily.Some key capabilities and benefits of Looker Studio include:Interactive dashboards - Users can...
SAP BusinessObjects is a comprehensive business intelligence and analytics software suite from SAP. It brings together capabilities for reporting, analysis, dashboards, data visualization, data discovery, and more to help organizations unlock value from their data.Key capabilities and components of SAP BusinessObjects include:Centralized semantic layer for consistent data across the organizationPowerful...
Redash is an open-source business intelligence and data visualization web application. It allows users to connect to multiple data sources including SQL databases, query and visualize the data, and create interactive dashboards to share insights.Some key features of Redash:Connect to data sources like PostgreSQL, MySQL, SQL Server, Redshift, BigQuery and...
Sisense is a business intelligence and data analytics software platform designed to help non-technical users prepare, analyze and visualize complex data. Some key features of Sisense include:Intuitive drag-and-drop interface for building interactive dashboards and visualizations like charts, graphs and pivot tables without coding.Ability to connect to wide variety of data...
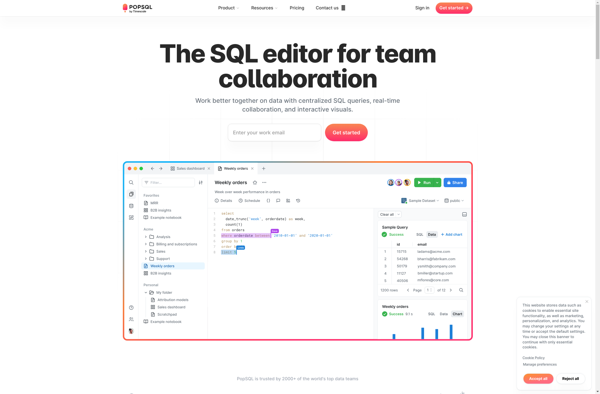
PopSQL is a cloud-based SQL editor that enables teams to collaborate on exploring and analyzing data. It provides an intuitive, browser-based interface for writing queries, visualizing results, and sharing data insights.Key features of PopSQL include:Collaborative editing - Multiple users can query the same datasets, share queries and visualizations, comment, and...
Amazon QuickSight is a fast, cloud-powered business intelligence service that makes it easy to build visualizations, perform ad-hoc analysis, and quickly get business insights from your data. Some key features include:Intuitive visual interface that makes it easy to visualize and explore dataBroad data connectivity to connect to data sources like...
Datapine is an easy-to-use business analytics and dashboard software designed to help businesses visualize, analyze and gain insights from their data. It provides powerful tools to access, clean, unify and model data from multiple sources, including SQL and NoSQL databases, cloud apps, spreadsheets, CSV files and more.Key features of Datapine...
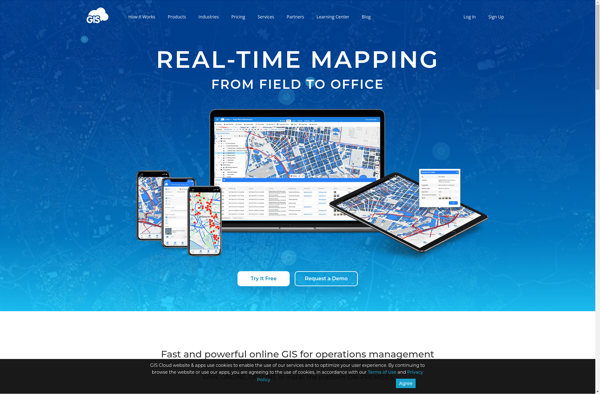
GIS Cloud is a feature-rich, cloud-based geographic information system (GIS) software designed for organizations of all sizes. It enables users to easily create, edit, analyze, and publish geospatial data through an intuitive web interface and mobile apps.Key capabilities and benefits of GIS Cloud include:Interactive web map building with access to...