Amazon QuickSight is a fast, cloud-powered business intelligence service that makes it easy to deliver insights to everyone in your organization. It helps you build visualizations, perform ad-hoc analysis, and quickly get business insights from your data.
Amazon QuickSight: Fast Cloud Business Intelligence
Amazon QuickSight is a fast, cloud-powered business intelligence service that makes it easy to deliver insights to everyone in your organization. It helps you build visualizations, perform ad-hoc analysis, and quickly get business insights from your data.
What is Amazon QuickSight?
Amazon QuickSight is a fast, cloud-powered business intelligence service that makes it easy to build visualizations, perform ad-hoc analysis, and quickly get business insights from your data. Some key features include:
Intuitive visual interface that makes it easy to visualize and explore data
Broad data connectivity to connect to data sources like AWS data services, third party applications, Excel, and more
Business user-focused, so anyone can create rich dashboards and visualizations without IT involvement
Enterprise security and governance features like fine-grained access controls, encryption, and auditing
Fast analysis on large datasets with SPICE in-memory caching
Options for sharing analytics via dashboards, reports, and auto-narrated stories
Integration with natural language search and AI through features like Amazon QuickSight Q
Amazon QuickSight is useful for organizations that want an easy way to unlock insights from data without investing heavily in infrastructure. Its pay-per-user pricing model allows for rapid adoption across the organization. Overall, QuickSight reduces the time to insight so companies can make faster, data-driven decisions.
Amazon QuickSight Features
Features
Fast, easy-to-use, cloud-powered business intelligence service
Rich set of visualizations and ability to drill down into data
Supports connecting to a wide variety of data sources
Built-in machine learning for anomaly detection and forecasting
Auto-SPICE natural language query
Embedded analytics capabilities
Collaboration features like sharing dashboards
Pricing
Pay-As-You-Go
Subscription-Based
Pros
Fast and easy to get started with BI
Scales to large data sets with good performance
Serverless - no infrastructure to manage
Broad data source connectivity
Embedded analytics and ML capabilities
Affordable pricing
Cons
Limited customization compared to open-source BI tools
Microsoft Power BI is a powerful business analytics service developed by Microsoft. It empowers users to transform raw data into meaningful insights, create interactive reports and dashboards, and share data-driven stories within an organization. Power BI is designed to help businesses and individuals make informed decisions based on a comprehensive...
Tableau is a leading business intelligence and data visualization platform used by organizations of all sizes to transform their data into easy-to-understand visualizations and dashboards. With Tableau, users can connect to a wide range of data sources, prepare and clean the data for analysis, and create interactive data visualizations such...
Looker Studio is a business intelligence and analytics platform designed to help companies analyze data and gain valuable insights. It provides an intuitive, web-based interface that enables users without technical skills to explore, visualize and share data easily.Some key capabilities and benefits of Looker Studio include:Interactive dashboards - Users can...
QlikView is a business intelligence and data visualization platform used to create interactive dashboards and analytics applications. It was first released in 1993 by the Swedish company Qlik. Key features of QlikView include:Associative data modeling and in-memory analytics engine - Allows fast analysis of large, disparate datasets without predefined schema...
Pentaho is a comprehensive open source business intelligence (BI) suite that provides a range of data integration, analytics, visualization, reporting, data mining, and workflow capabilities. It is designed to help businesses consolidate data from disparate sources for unified analytics and reporting.Some of the key capabilities and components of Pentaho include:Data...
Google Fusion Tables is a cloud-based service designed for working with structured data. It allows users to upload, host, manage, share, visualize and collaborate on tabular datasets. Some of the key features of Google Fusion Tables include:Data importing from various formats like CSV, KML, spreadsheetsData exporting to formats like CSV...
Snapboard is an online visual collaboration software used by teams for brainstorming, organizing workflows, managing projects, and more. It provides an infinite virtual whiteboard where users can add sticky notes, images, freehand drawings, and diagrams to capture ideas and map out plans.Key features of Snapboard include:Infinite canvas for adding unlimited...
SAP BusinessObjects is a comprehensive business intelligence and analytics software suite from SAP. It brings together capabilities for reporting, analysis, dashboards, data visualization, data discovery, and more to help organizations unlock value from their data.Key capabilities and components of SAP BusinessObjects include:Centralized semantic layer for consistent data across the organizationPowerful...
Cluvio is a business intelligence and analytics software designed for small and medium-sized businesses. It aims to make data analytics accessible to non-technical users through an intuitive graphical interface. Some key capabilities and benefits of Cluvio include:Interactive dashboards - Users can create customizable dashboards to visualize important business metrics and...
Widestage is an enterprise-grade platform for live video streaming, webinars, and webcasts. It enables businesses, event organizers, education institutions and media publishers to easily broadcast content in real-time to engage with their audience.Key features of Widestage include:Intuitive dashboards for managing live events, presenters, registration, and branding.Robust viewing portal allowing viewers...
Spotfire is a business intelligence and analytics software platform designed for interactive data discovery and visualization. It enables rapid analysis of large, complex data sets to uncover deeper insights.Key features of Spotfire include:Interactive dashboards and visualizations - Drag-and-drop interface to create customized data visualizations like heat maps, charts, graphs, and...
amCharts is a feature-rich JavaScript charting library that enables you to create interactive charts, dashboards, and data visualizations. With amCharts, you can build solutions for both web and mobile platforms.Some key capabilities and benefits of amCharts include:Supports a wide variety of chart types: line, column, bar, pie, radar, scatter, gauges,...
Redash is an open-source business intelligence and data visualization web application. It allows users to connect to multiple data sources including SQL databases, query and visualize the data, and create interactive dashboards to share insights.Some key features of Redash:Connect to data sources like PostgreSQL, MySQL, SQL Server, Redshift, BigQuery and...
DIVE (Data Insight Visualization Explorer) is an open source web application developed by researchers at the MIT Media Lab. It is designed to enable interactive exploration and visualization of complex, multi-faceted datasets.Some key features of DIVE include:Intuitive drag-and-drop interface for rapidly building visualizations like maps, charts, graphs, and moreSupport for...
LightCat is an emerging open-source password manager that allows users to securely store website logins, credit card numbers, identities, and other sensitive information behind one master password. It utilizes strong AES-256 bit encryption to protect user data and ensures information is accessible only to the owner.Some key features of LightCat...
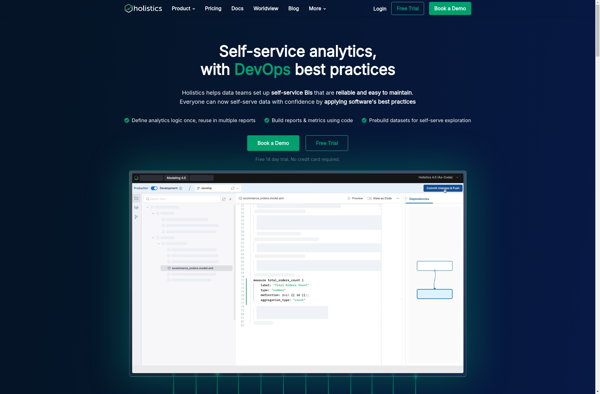
Holistics is an AI-powered unified data platform designed to help companies build and manage their data infrastructure. It provides an intuitive interface for data teams to ingest, prepare, analyze, and visualize data from diverse sources.Key capabilities include:Smart data collection and ingestion from databases, cloud apps, APIs etc.Automated data mapping, cleansing,...
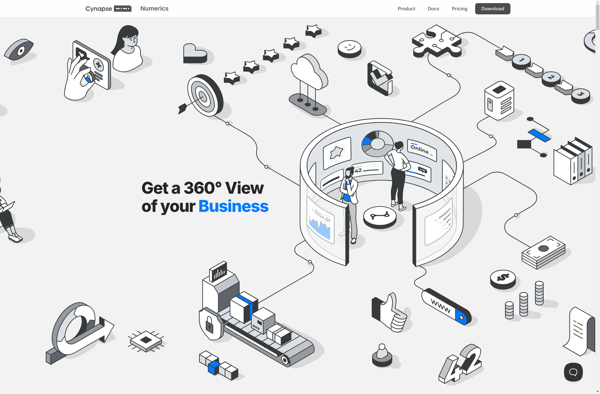
Numerics is an open-source data analysis and visualization application designed for engineering, science, finance, and other domains that work with numeric data. It provides a flexible platform for analyzing, transforming, and visualizing numeric datasets of virtually any size and dimension.Some of the key features and capabilities of Numerics include:Importing and...
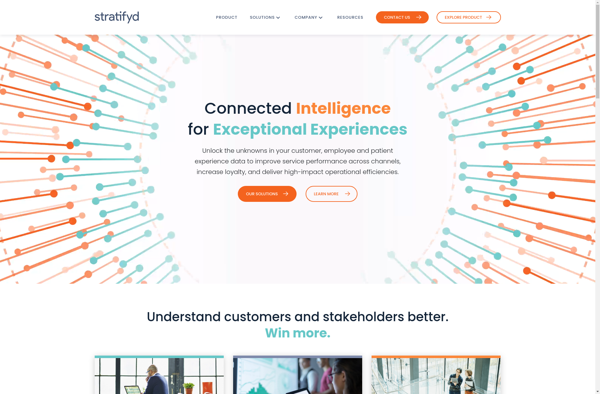
Stratifyd is a cloud-based business intelligence and analytics platform suitable for companies of all sizes. It helps businesses organize data from multiple sources, analyze it using AI and machine learning capabilities, and gain actionable insights to improve decision-making.Key features and benefits include:Automated ETL processes to combine and prepare data from...
Vis.js is an open source data visualization library built with JavaScript. It allows developers to create interactive visualizations such as timelines, networks and graphs easily in the browser using web standards.Some of the key features of Vis.js include:Various data visualization modules for timelines, networks, graphs etc.Easily customizable and extensible to...
QueryTree is a visual SQL analytics software designed to make query building fast and easy for any skill level. It features an intuitive drag-and-drop interface that allows users to construct complex SQL queries visually without typing code.Some key features of QueryTree include:Visual query builder with drag-and-drop fields and quick type...
Datapine is an easy-to-use business analytics and dashboard software designed to help businesses visualize, analyze and gain insights from their data. It provides powerful tools to access, clean, unify and model data from multiple sources, including SQL and NoSQL databases, cloud apps, spreadsheets, CSV files and more.Key features of Datapine...
Smoothie Charts is an open-source JavaScript charting library designed specifically for real-time streaming data visualization. Some key features include:Optimized for line, bar, scatter, spline, and area graphs using canvasFast animation with a small code footprint suitable for embedded devicesHandles large volumes of real-time data without dropping framesCustomizable scales, interpolation modes,...
Keeeb is an open-source, keyboard-focused note taking and productivity app for Windows, Mac and Linux operating systems. It is designed specifically for power users who prefer to use keyboard shortcuts over reaching for the mouse.Some of the key features of Keeeb include:Quick note taking - easily capture thoughts, notes, web...
Marple is an open-source, Markdown-based slide deck tool for creating presentations. It provides a minimalistic editor interface to write slide content in Markdown format, which then gets rendered into an elegant slide deck for presenting.Some key features of Marple:Write slide content in easy-to-read and write Markdown format. Format headings, lists,...
Stagraph is a powerful yet easy-to-use data visualization and analytics platform designed for modern business needs. As a cloud-based solution, Stagraph enables users to effortlessly map, analyze, and gain actionable insights from even the most complex data sets through intuitive drag-and-drop visualizations.Key capabilities and benefits include:Intelligible and interactive data visualizations...
uvCharts is an open-source JavaScript charting library for building interactive data visualizations for the web. Some key features and benefits of uvCharts include:Open source and completely free to useLightweight at only 15kB gzippedSupports a wide variety of chart types including line, bar, pie, scatter, area charts and moreExtensive customization options...
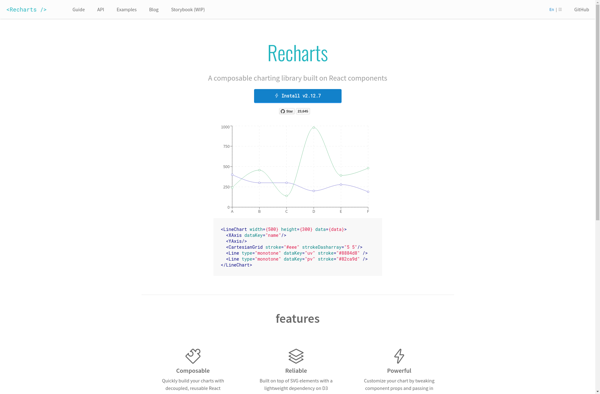
Recharts is an open-source React charting library used to build various data visualizations and interactive charts. It is Declarative, Component-Based, and highly customizable to create charts such as line, bar, pie, radar, scatter, treemap and more.Some key features of Recharts:Supports both SVG and Canvas rendering using a unified APIResponsive design...
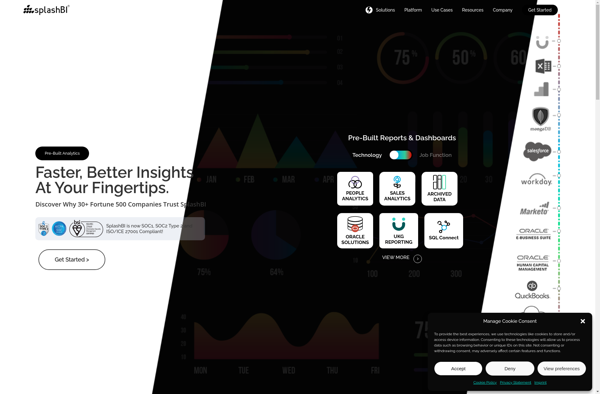
SplashBI is a cloud-based business intelligence and data visualization platform designed for small and medium businesses. Some key features of SplashBI include:Intuitive drag-and-drop interface for building interactive dashboards, charts, tables and reportsLibrary of customizable widgets and visualizations including bar, line and pie chartsAutomated report scheduling and distributionReal-time data connectivity to...
Datacopia is an open-source data workflow and pipeline tool designed for integrating, moving, and transforming data across databases, data warehouses, lakes, and other systems. It provides an easy to use visual interface to build and manage complex data pipelines without coding.Key features of Datacopia include:Visual data pipeline designer to model...
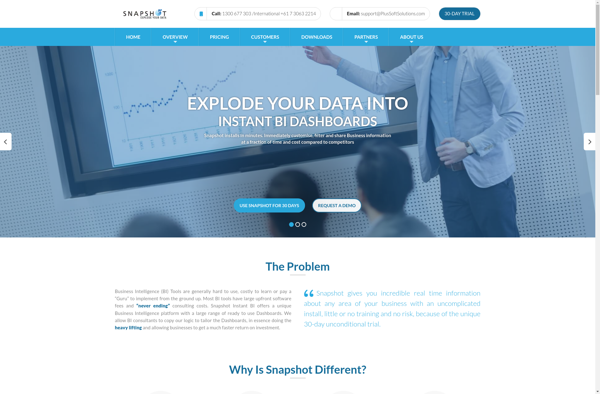
Snapshot BI is a business intelligence and analytics software designed specifically for small and medium-sized businesses. It provides an easy-to-use platform for companies to visualize, analyze, and gain actionable insights from their business data.Key features of Snapshot BI include:Interactive dashboards and reports - Create customized dashboards with drag-and-drop widgets to...
Parrily is a cloud-based project management and team collaboration software designed specifically for agile development teams. It provides a variety of features to help manage projects, track progress, and facilitate teamwork:- Kanban boards - Visualize tasks and user stories on digital kanban boards. Move items through defined workflows to track...
Chartkick is an open-source charting library for Ruby on Rails applications. It provides a simple domain-specific language for generating interactive charts and graphs without writing any JavaScript. Chartkick supports various chart types like line charts, pie charts, column charts, bar charts and more.Some key features of Chartkick:Easy integration into Rails...
KiniMetrix is a cloud-based software platform designed for healthcare providers to help them better manage their practices, engage with patients, gain population health insights, and handle administrative tasks. It combines features typically found in separate electronic health record (EHR), practice management, patient portal and business intelligence solutions into one unified...
Datawatch is a business intelligence and analytics platform designed for self-service data preparation, reporting and visualization. Some key capabilities and features of Datawatch include:Data Connectivity - Datawatch can connect to a wide variety of data sources like databases, applications, flat files, big data platforms and more. It provides connectivity to...
Ember Charts is an open-source JavaScript charting library built for use in Ember.js applications. It provides a set of reusable Ember components and services to help developers quickly add beautiful, interactive charts and graphs to their apps.Key features of Ember Charts include:Tight integration with Ember's data layer - easily bind...
Cortana Analytics is an integrated suite of intelligence tools and services from Microsoft designed to help organizations make data-driven decisions. It includes the following core components:Azure Machine Learning - A cloud service for building and deploying predictive analytics solutions and machine learning modelsHDInsight - Managed Hadoop, Spark, and other big...
CollateBox is a free online application designed to help researchers and academics organize, manage, and share their PDF documents and research papers in one central location. It serves as a digital research repository that aims to make collecting, sorting, and accessing academic papers and literature more efficient.Some key features of...
Bime is a flexible business intelligence and analytics platform suitable for modern data teams. It provides an easy way to connect to various data sources like databases, cloud apps, and business software to build interactive dashboards, reports, and analytics.Some key capabilities and benefits of Bime include:Intuitive drag-and-drop interface to visualize...
Analyza is a business intelligence and data analytics software platform designed to help companies make data-driven decisions. It provides tools for data preparation, interactive visualization, dashboarding, reporting, and predictive analytics.Key features of Analyza include:Intuitive drag-and-drop interface for building dashboards and reports without codingHundreds of customizable data visualization options including charts,...
Alpine Data Labs is an end-to-end predictive analytics platform designed for data science teams to build and deploy predictive models. It aims to make advanced analytics more accessible and collaborative.Key features of Alpine Data Labs include:Intuitive graphical interface for loading data from various sources, cleaning and munging data, exploring relationships,...
Mantle Enterprise Analytics is a robust business intelligence and analytics solution catered towards large enterprises. It provides a wide range of capabilities to collect, store, process, analyze, and visualize data across the organization.Key features include:Interactive dashboards and reports for data visualizationPredictive modeling, forecasting, and machine learning algorithmsConnectors to extract data...
n3-charts is a feature-rich JavaScript charting library for adding interactive data visualizations to web apps and sites. Developed with focus on performance, customizability and ease-of-use, n3-charts allows developers to quickly build various types of charts and graphs to effectively visualize data.With n3-charts, you can create line, bar, column, area, pie,...
AnyChart is a feature-rich JavaScript charting library that enables developers to easily add interactive charts and dashboards to web and mobile applications. With its lightweight architecture, AnyChart aims to provide high performance chart rendering optimized even for large datasets.AnyChart supports over 80 chart types including column, bar, line, area, pie,...
EJSCharts is a flexible JavaScript charting library for adding interactive charts and graphs to web applications and sites. It is built on top of the EJ2 JavaScript library and integrates seamlessly with other Syncfusion UI components.With EJSCharts, you can create over 35 chart types including line, area, bar, pie, doughnut,...
bipp Analytics is a business intelligence and data visualization software that empowers users to connect their data, analyze it visually, and extract meaningful insights. Some key features of bipp Analytics include:Data Connectors - Connect your data from databases, cloud apps, Excel, etc. with pre-built connectors.Interactive Dashboards - Build visually appealing,...