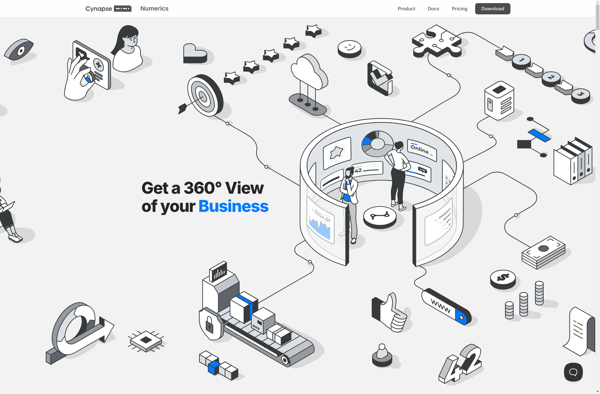
Numerics is an open-source data analysis and visualization software for scientific computing. It provides an interactive environment for analyzing and visualizing numeric data from a wide range of domains including engineering, science, finance, and more.
Numerics: Open-Source Data Analysis and Visualization Software
Numerics is an open-source data analysis and visualization software for scientific computing. It provides an interactive environment for analyzing and visualizing numeric data from a wide range of domains including engineering, science, finance, and more.
What is Numerics?
Numerics is an open-source data analysis and visualization application designed for engineering, science, finance, and other domains that work with numeric data. It provides a flexible platform for analyzing, transforming, and visualizing numeric datasets of virtually any size and dimension.
Some of the key features and capabilities of Numerics include:
Importing and working with numeric data from a variety of file formats including text/CSV, Excel, binaries, HDF5, NetCDF, and more
Powerful data transformation tools for reshaping, pivoting, filtering, aggregating, and cleaning datasets
Statistical analysis functionality such as correlation analysis, hypothesis testing, regression modeling, and multivariate analysis
High-performance numeric computation engine with support for vector/matrix operations, linear algebra, Fourier transforms, differential equations, and more
Interactive 2D and 3D data visualization with XY plots, heatmaps, surface plots, volume rendering, scatter plots, and more
Extensive catalog of chart types for effective data visualization and communication
Custom scripting and extensibility with Python, Lua, or C to automate workflows or implement custom analyses
Cross-platform support for Windows, Mac, and Linux
With its breadth of analytics capabilities paired with flexible visualization, Numerics is well-suited for researchers, engineers, financial analysts, and other technical roles that rely heavily on understanding and deriving insights from numeric data.
Numerics Features
Features
Interactive data analysis environment
Supports multiple programming languages like Python, R, Julia, etc
Visualization capabilities including 2D and 3D plotting
Statistical analysis tools
Can connect to databases and big data platforms
Extendable with custom scripts and plugins
Pricing
Open Source
Pros
Free and open source
Cross-platform compatibility
Powerful analytics and visualization
Customizable and extensible
Supports connecting to data from different sources
Cons
Steep learning curve
Limited built-in statistical analysis compared to dedicated statistics software
Visualizations may not be as polished as commercial alternatives
Lacks some user-friendly features of commercial alternatives
Google Analytics is a free web analytics service offered by Google that tracks and reports website traffic. It is the most widely used web analytics service on the Internet.Some key features of Google Analytics include:Tracking number of visitors, page views, bounce rate, session duration, demographics, location, behavior and moreIn-depth analysis...
Microsoft Power BI is a powerful business analytics service developed by Microsoft. It empowers users to transform raw data into meaningful insights, create interactive reports and dashboards, and share data-driven stories within an organization. Power BI is designed to help businesses and individuals make informed decisions based on a comprehensive...
Tableau is a leading business intelligence and data visualization platform used by organizations of all sizes to transform their data into easy-to-understand visualizations and dashboards. With Tableau, users can connect to a wide range of data sources, prepare and clean the data for analysis, and create interactive data visualizations such...
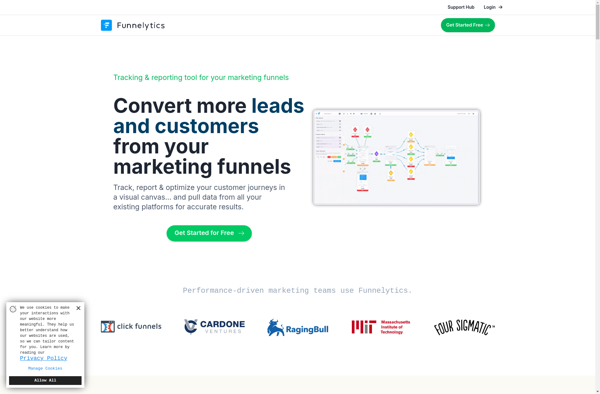
Funnelytics is a comprehensive marketing analytics platform designed to help businesses visualize and optimize their conversion funnels and customer journeys. It integrates data from multiple sources like websites, ads, CRM systems, etc. to create a single customer view.Key features of Funnelytics include:Interactive conversion funnel analysis to identify sticking points and...
Matomo (formerly Piwik) is a leading open-source web analytics platform focused on privacy. It gives users valuable insights into their website, app, etc. traffic and engagement, while letting them retain full ownership and control of their analytics data.As an on-premises solution, Matomo provides an alternative to sending data to third-party...
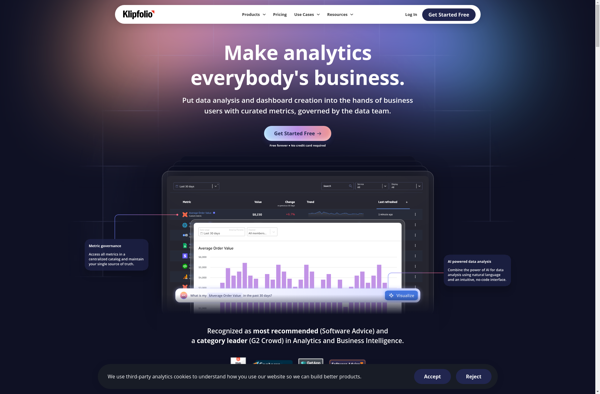
Klipfolio PowerMetrics is a flexible, cloud-based business intelligence and data visualization platform designed to help businesses gain insights from their data. Some key features include:Customizable dashboards - Users can build interactive dashboards with charts, graphs, tables, images and more to visualize key data.Real-time data connectivity - Connect to cloud apps,...
Shynet is an open-source, decentralized network that serves as an alternative to the traditional internet. It allows users to access websites, applications, and services without going through centralized servers that can monitor traffic or censor content.Instead, Shynet operates on a peer-to-peer model where user devices connect directly to each other...
AppLink.io is a flexible no-code automation platform designed to help teams build and connect custom internal tools and workflows. It provides an easy way to integrate your favorite cloud services like G Suite, Office 365, Salesforce, Slack, and more without needing developers or writing any code.With an intuitive drag-and-drop interface,...
SumAll is a cloud-based social media analytics platform designed to help marketers and businesses aggregate and analyze data from multiple social media channels. It pulls metrics from popular platforms like Facebook, Twitter, Instagram, YouTube, and LinkedIn into one centralized dashboard to give users a holistic view of their social media...
Amazon QuickSight is a fast, cloud-powered business intelligence service that makes it easy to build visualizations, perform ad-hoc analysis, and quickly get business insights from your data. Some key features include:Intuitive visual interface that makes it easy to visualize and explore dataBroad data connectivity to connect to data sources like...
Status Board is a business intelligence and data visualization software used to track important metrics and KPIs. It allows users to create interactive dashboards that aggregate and display data from various sources such as Google Analytics, Salesforce, MySQL databases, Excel spreadsheets etc.Key features of Status Board include:Visualize data through charts,...
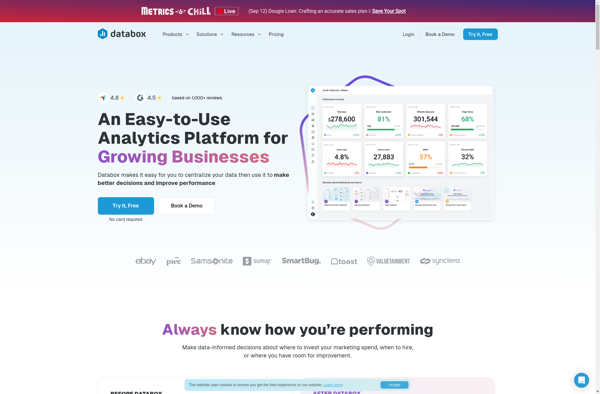
Databox is an open-source personal data platform that enables individuals to manage their personal data securely and privately. Developed by researchers at Imperial College London and the University of Cambridge, Databox allows users to connect data sources like smartphones, wearables, and web apps to feed data into the platform.Once data...
Marple is an open-source, Markdown-based slide deck tool for creating presentations. It provides a minimalistic editor interface to write slide content in Markdown format, which then gets rendered into an elegant slide deck for presenting.Some key features of Marple:Write slide content in easy-to-read and write Markdown format. Format headings, lists,...
Flurry is a mobile analytics platform used by app developers to understand how consumers interact with their mobile applications. It provides key metrics like daily active users, session length, retention, and device profiles. Key features of Flurry include:User analytics - Track number of active users, sessions, frequency and length of...
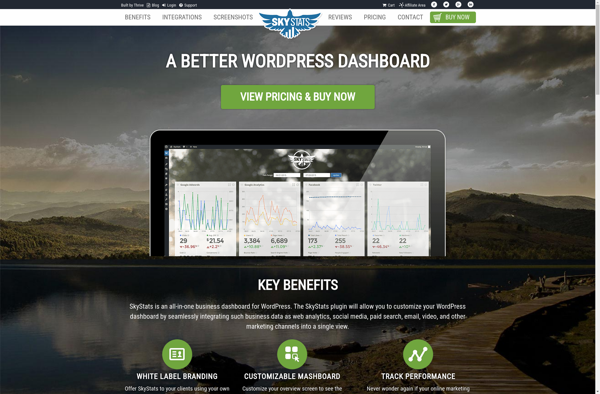
SkyStats is a robust statistics and analytics platform built to provide photographers, creative agencies, and media professionals with deep insights into their business and audience. As an all-in-one solution, SkyStats tracks website traffic, social media engagement, email marketing metrics, online sales, and more to uncover trends and opportunities for growth.Key...
Quantum.io is a cloud-based artificial intelligence platform designed to make building and deploying AI solutions faster, easier, and more accessible. The platform includes tools and services for the full AI lifecycle:- Data integration services allow users to securely connect data sources like databases, cloud storage, APIs, and more to Quantum's...
Apsalar is a mobile app analytics and marketing platform designed specifically for mobile app developers and marketers. It provides:Attribution - Track app installs and events across multiple marketing channels like ads, organic, referral links and measure the true marketing ROI.Audience Segmentation - Segment users based on their actions within the...
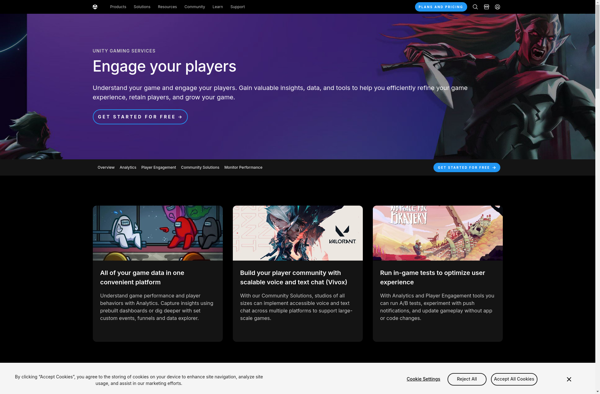
deltaDNA is a game analytics and player engagement platform aimed at helping game developers better understand and engage their players. Some key features of deltaDNA include:Player analytics - Track and analyze player behavior, spending, progression, churn and more to understand your players.Player segmentation - Automatically group players into segments based...
CircleBI is a flexible business intelligence and analytics platform used by companies to visualize data and uncover insights for better decision making. It provides interactive dashboards, reports, and charts that connect to various data sources like databases, spreadsheets, etc.Key features of CircleBI include:Customizable dashboards to monitor KPIsAd-hoc reporting to quickly...
Ducksboard is a cloud-based business intelligence and data visualization platform used by companies to monitor key performance indicators and other metrics in real-time. It allows users to create customizable dashboards using a drag-and-drop interface and various widget types like charts, graphs, gauges, tables, and more.Some key features of Ducksboard include:Real-time...
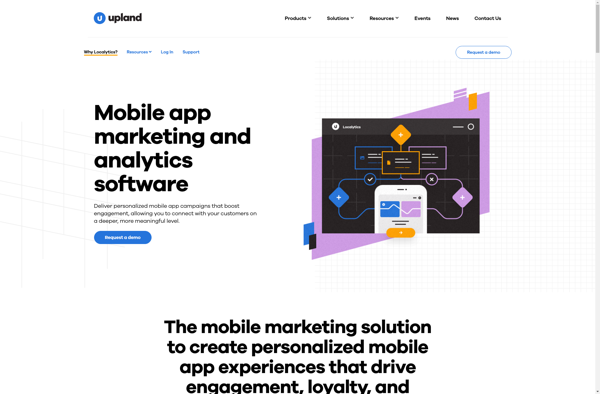
Localytics is a mobile app analytics and engagement platform used by app developers to better understand user behavior and drive better app engagement. Some key features of Localytics include:Detailed analytics - Localytics provides insights into various app usage metrics like daily/monthly active users, session length, retention rates, device types, operating...
Fruit Dashboard is a powerful, easy-to-use business intelligence and data visualization platform built specifically for the fruit industry. Companies of any size can use Fruit Dashboard to connect data from multiple sources, build interactive dashboards and reports, set metrics and KPIs, and gain valuable insights.With drag-and-drop simplicity, Fruit Dashboard makes...
Informly is a robust customer feedback and product reviews software designed to help companies better understand and act on customer opinions. It includes the following key features:NPS Surveys - Send customized Net Promoter Score surveys via email and SMS to measure customer loyalty.In-App Surveys - Embed feedback forms directly into...