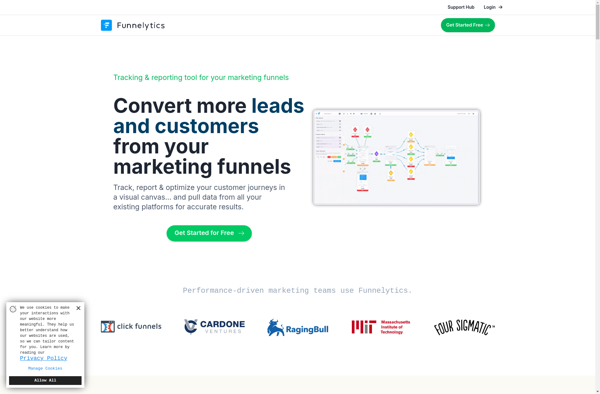
Funnelytics is a marketing analytics software that helps businesses track customer journeys and analyze conversion funnels. It provides insights into where customers are dropping off in the sales process so marketers can optimize their campaigns.
Funnelytics is a marketing analytics software that helps businesses track customer journeys and analyze conversion funnels. It provides insights into where customers are dropping off in the sales process so marketers can optimize their campaigns.
What is Funnelytics?
Funnelytics is a comprehensive marketing analytics platform designed to help businesses visualize and optimize their conversion funnels and customer journeys. It integrates data from multiple sources like websites, ads, CRM systems, etc. to create a single customer view.
Key features of Funnelytics include:
Interactive conversion funnel analysis to identify sticking points and opportunities.
Customer journey mapping to understand paths to purchase.
Cohort analysis for analyzing groups of similar customers over time.
A/B testing capability to test and improve campaigns.
Custom dashboards and reporting to share insights across teams.
Integration with popular data sources like Google Analytics, Salesforce, Facebook Ads, etc.
Attribution modeling to evaluate influence of different campaigns on conversions.
Funnelytics is used by marketing teams at ecommerce companies, SaaS businesses, agencies, and enterprises. It provides powerful analytics capabilities in an easy-to-use and intuitive UI. With actionable insights, marketers can optimize visitor traffic, increase conversion rates, and improve ROI of marketing campaigns with Funnelytics.
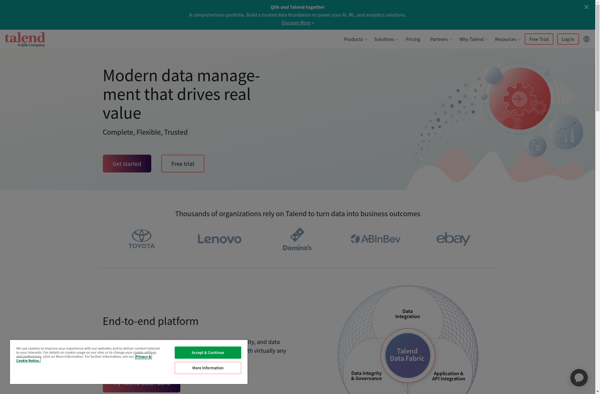
Talend is an open source data integration and management platform designed to help organizations effectively collect, transform, cleanse and share data across systems and teams. Some key capabilities and benefits of Talend include:Graphical drag-and-drop interface to build data integration jobs and workflows without codingOver 900 pre-built data connectors to leading...
QlikView is a business intelligence and data visualization platform used to create interactive dashboards and analytics applications. It was first released in 1993 by the Swedish company Qlik. Key features of QlikView include:Associative data modeling and in-memory analytics engine - Allows fast analysis of large, disparate datasets without predefined schema...
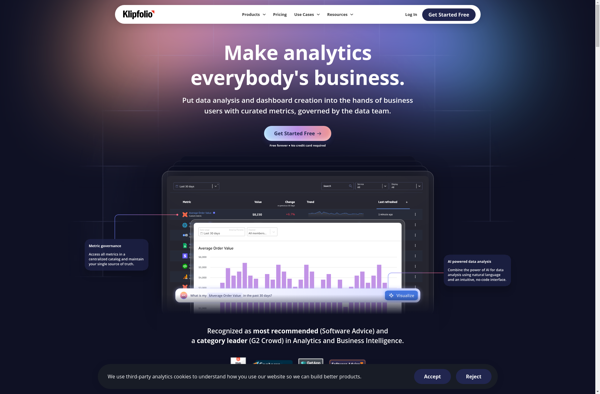
Klipfolio PowerMetrics is a flexible, cloud-based business intelligence and data visualization platform designed to help businesses gain insights from their data. Some key features include:Customizable dashboards - Users can build interactive dashboards with charts, graphs, tables, images and more to visualize key data.Real-time data connectivity - Connect to cloud apps,...
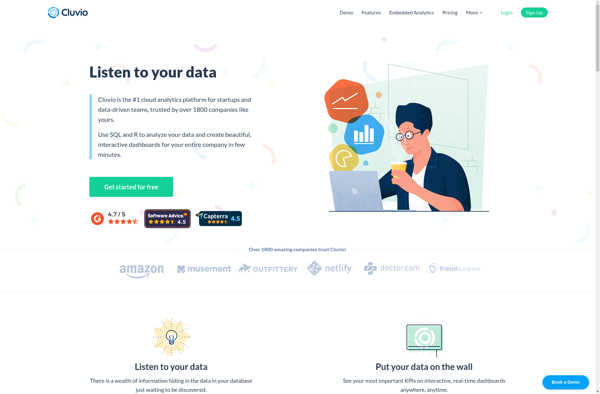
Cluvio is a business intelligence and analytics software designed for small and medium-sized businesses. It aims to make data analytics accessible to non-technical users through an intuitive graphical interface. Some key capabilities and benefits of Cluvio include:Interactive dashboards - Users can create customizable dashboards to visualize important business metrics and...
Sisense is a business intelligence and data analytics software platform designed to help non-technical users prepare, analyze and visualize complex data. Some key features of Sisense include:Intuitive drag-and-drop interface for building interactive dashboards and visualizations like charts, graphs and pivot tables without coding.Ability to connect to wide variety of data...
Chartio is a cloud-based business intelligence and data visualization platform designed to help companies analyze data and share actionable insights. It allows users to connect a variety of data sources including databases, cloud apps, and spreadsheets, and build interactive dashboards and charts.Key features of Chartio include:Intuitive drag and drop interface...
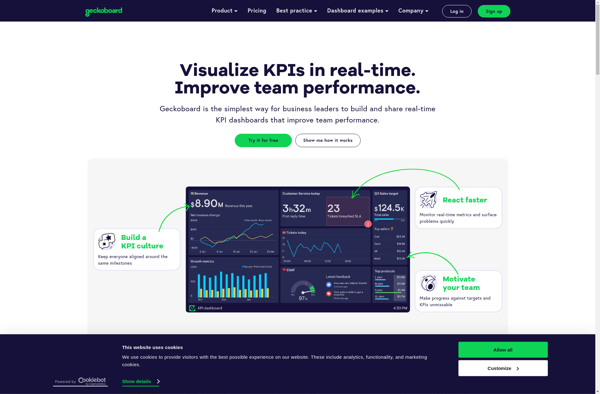
Geckoboard is a cloud-based business intelligence and data visualization platform used by over 30,000 companies worldwide. It allows users to build interactive TV dashboards that bring together data from various sources, both within a company and from external applications, to provide real-time visibility into critical metrics.Geckoboard integrates with 100+ data...
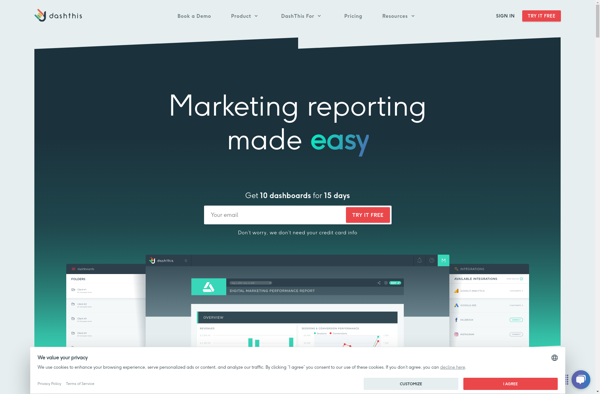
DashThis is a user-friendly project management and task tracking application designed for small teams and businesses. It provides an intuitive interface to plan projects, create tasks, set due dates, assign work to team members, track progress, and collaborate with others.Some key features of DashThis include:Flexible project views - See all...
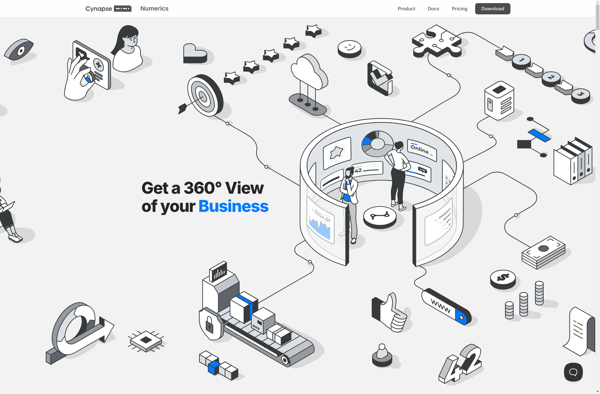
Numerics is an open-source data analysis and visualization application designed for engineering, science, finance, and other domains that work with numeric data. It provides a flexible platform for analyzing, transforming, and visualizing numeric datasets of virtually any size and dimension.Some of the key features and capabilities of Numerics include:Importing and...
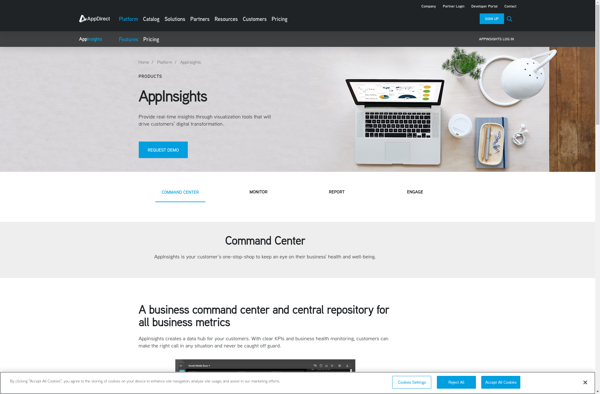
AppInsights is an extensive application performance management (APM) service provided by Microsoft Azure. It allows developers to easily monitor their live web applications and track key metrics like response time, failure rates, dependency rates, and more. Some key capabilities of AppInsights:Monitor response time, failure rates, exceptions to identify performance issues...
Vizydrop is a comprehensive graphic design and video editing software suitable for entrepreneurs, small business owners, marketers, social media managers, students, and anyone who needs to create visual content.With its drag-and-drop interface, Vizydrop makes graphic design and video creation accessible even for beginners. It has various templates and assets that...
QueryTree is a visual SQL analytics software designed to make query building fast and easy for any skill level. It features an intuitive drag-and-drop interface that allows users to construct complex SQL queries visually without typing code.Some key features of QueryTree include:Visual query builder with drag-and-drop fields and quick type...
Datapine is an easy-to-use business analytics and dashboard software designed to help businesses visualize, analyze and gain insights from their data. It provides powerful tools to access, clean, unify and model data from multiple sources, including SQL and NoSQL databases, cloud apps, spreadsheets, CSV files and more.Key features of Datapine...
Startegy is a comprehensive business strategy software designed to help organizations develop, execute, and manage their strategic plans effectively. It provides a centralized workspace for strategic planning and performance management.Key features of Startegy include:Objectives Management - Set organizational objectives, link them to overarching strategy, assign owners, and track progressStrategy Mapping...
Everview is a visual collaboration software designed to simplify the design review and feedback process for teams. It provides a single online space to upload, discuss, and iterate on any visual content, including design files, documents, websites, presentations, and more.Some key features of Everview include:Real-time commenting and annotation tools for...
Datameer is an end-to-end data analytics and business intelligence platform built to enable organizations to extract valuable insights from massive datasets from various sources. It simplifies data integration, exploration, and analytics across Hadoop, Spark, cloud platforms, data warehouses, spreadsheets, and more.Key capabilities and benefits of Datameer include:Intuitive spreadsheet-like interface to...
Bilbeo Analytics is a leading web analytics software designed to help businesses understand customer behavior and optimize conversion rates. It provides in-depth analysis through interactive dashboards, reports, and visualizations of key metrics like traffic sources, page views, conversions, and more.Some key features of Bilbeo Analytics include:Customizable dashboards - Build interactive...