Chartio is a business intelligence and data visualization tool that allows users to connect data sources, build charts and dashboards, and share analytics and insights. It has an easy-to-use drag and drop interface for creating visualizations quickly.
Chartio: Business Intelligence & Data Visualization Tool
Connect data sources, build charts and dashboards, and share analytics with Chartio's easy-to-use drag and drop interface.
What is Chartio?
Chartio is a cloud-based business intelligence and data visualization platform designed to help companies analyze data and share actionable insights. It allows users to connect a variety of data sources including databases, cloud apps, and spreadsheets, and build interactive dashboards and charts.
Key features of Chartio include:
Intuitive drag and drop interface for quickly building charts and dashboards without coding
Broad data connectivity to cloud data sources like MySQL, PostgreSQL, AWS Redshift, Google Analytics, Salesforce, and more
Automated data modeling and schema detection
Custom SQL editor for more advanced users
Chart builder with 35+ chart types including tables, line, bar, geo, and pie charts
Dashboarding capabilities for assembling visualizations into shareable views
Collaboration tools like annotations and presentations to share insights
Robust access control and data governance capabilities
APIs and integrations with Slack, Google Data Studio, and others
Chartio is designed to be easy for business users of all skill levels. Its drag and drop chart builder and simple, intuitive interface lets non-technical users quickly visualize and make sense of data. More technical users have access to custom SQL and APIs for complex analysis and workflows. Subscriptions are priced per user based on features.
Chartio Features
Features
Connect to multiple data sources
Create custom charts and dashboards
Drag-and-drop interface for easy visualization creation
Collaborative features for sharing and commenting on dashboards
Mobile-friendly dashboards
SQL editor for advanced data analysis
Real-time data updates
White-labeling and branding options
Pricing
Freemium
Subscription-Based
Pros
Intuitive and user-friendly interface
Wide range of data source integrations
Customizable and interactive dashboards
Collaborative features for team-based analysis
Mobile-friendly design for on-the-go access
Cons
Limited free plan with restricted features
Pricing can be expensive for larger organizations
Some advanced features may require technical expertise
Limited data visualization options compared to other BI tools
Microsoft Power BI is a powerful business analytics service developed by Microsoft. It empowers users to transform raw data into meaningful insights, create interactive reports and dashboards, and share data-driven stories within an organization. Power BI is designed to help businesses and individuals make informed decisions based on a comprehensive...
Tableau is a leading business intelligence and data visualization platform used by organizations of all sizes to transform their data into easy-to-understand visualizations and dashboards. With Tableau, users can connect to a wide range of data sources, prepare and clean the data for analysis, and create interactive data visualizations such...
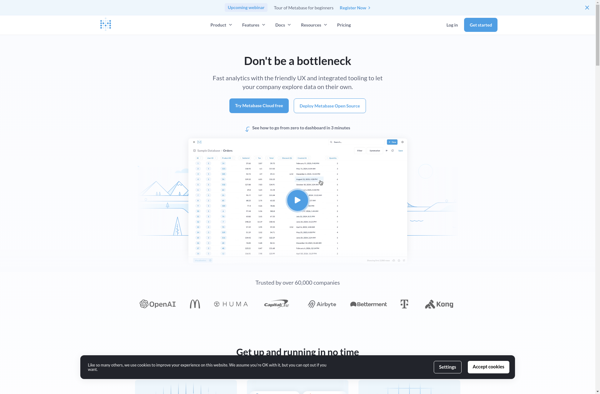
Metabase is an open source business intelligence platform and analytics tool. It allows anyone on a team to ask questions about their data, explore it, and share insights with others through easy-to-create dashboards, charts, and visualizations. Metabase provides an intuitive frontend interface so users can get answers and discover trends...
Looker Studio is a business intelligence and analytics platform designed to help companies analyze data and gain valuable insights. It provides an intuitive, web-based interface that enables users without technical skills to explore, visualize and share data easily.Some key capabilities and benefits of Looker Studio include:Interactive dashboards - Users can...
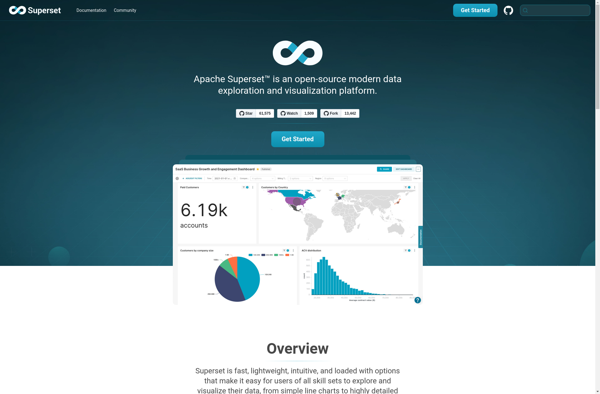
Apache Superset, formerly known as Caravel, is an open-source business intelligence (BI) web application. It was created by Maxime Beauchemin at Airbnb.Superset allows you to explore and visualize data, create interactive dashboards, and share insights across your organization. It integrates with common database technologies like MySQL, Postgres, SQL Server, and...
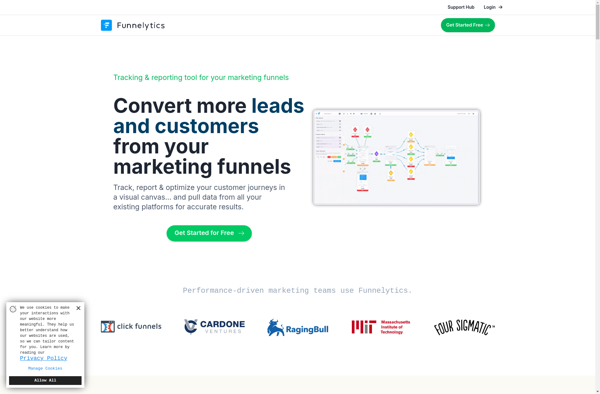
Funnelytics is a comprehensive marketing analytics platform designed to help businesses visualize and optimize their conversion funnels and customer journeys. It integrates data from multiple sources like websites, ads, CRM systems, etc. to create a single customer view.Key features of Funnelytics include:Interactive conversion funnel analysis to identify sticking points and...
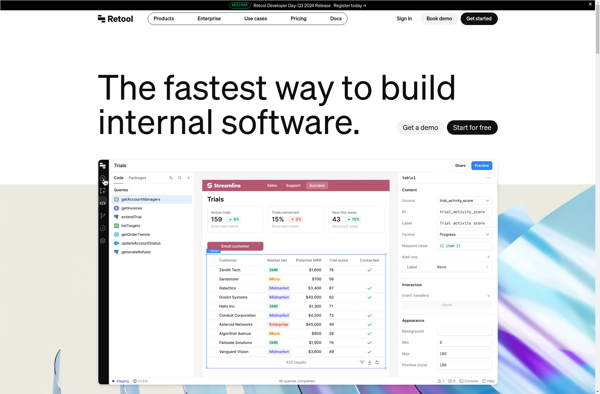
Retool is a low-code development platform designed to help teams build internal tools and business applications faster. It provides an easy-to-use drag and drop interface that allows you to quickly build workflows, forms, charts, kanban boards and more without needing to write any code.Some key features of Retool include:Connects to...
Redash is an open-source business intelligence and data visualization web application. It allows users to connect to multiple data sources including SQL databases, query and visualize the data, and create interactive dashboards to share insights.Some key features of Redash:Connect to data sources like PostgreSQL, MySQL, SQL Server, Redshift, BigQuery and...
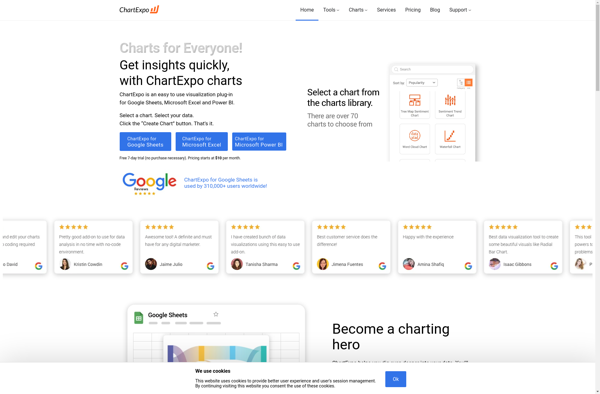
ChartExpo is a versatile business intelligence and data visualization software designed to help companies visualize and analyze data through interactive dashboards. It allows users to connect to various data sources including SQL databases, cloud apps, Excel files, etc. and pull data into the software.Some key features of ChartExpo include:Drag-and-drop interface...
Vizydrop is a comprehensive graphic design and video editing software suitable for entrepreneurs, small business owners, marketers, social media managers, students, and anyone who needs to create visual content.With its drag-and-drop interface, Vizydrop makes graphic design and video creation accessible even for beginners. It has various templates and assets that...
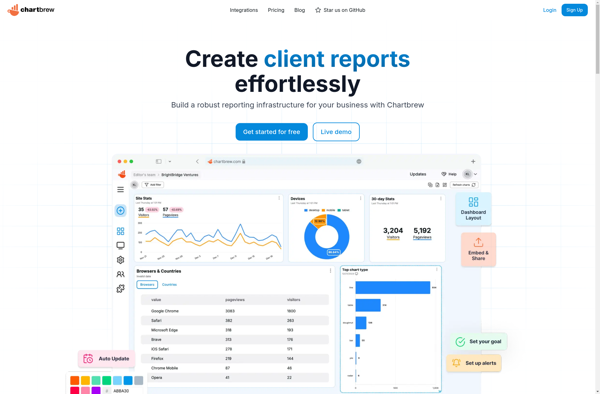
Chartbrew is an open-source business intelligence and data visualization platform used to analyze data and create interactive charts, graphs, and dashboards. It has an easy-to-use drag and drop interface that allows users to connect to SQL, NoSQL, CSV data sources, and SaaS applications to visualize data and find insights.Some key...
Keeeb is an open-source, keyboard-focused note taking and productivity app for Windows, Mac and Linux operating systems. It is designed specifically for power users who prefer to use keyboard shortcuts over reaching for the mouse.Some of the key features of Keeeb include:Quick note taking - easily capture thoughts, notes, web...
Draxlr is an open-source project management and collaboration tool similar to Trello. It allows you to create boards containing lists and cards to plan tasks and projects.Some key features of Draxlr include:Custom boards with as many columns and cards as you needDrag-and-drop interface to easily reorder cardsMultiple assigned members per...
Marple is an open-source, Markdown-based slide deck tool for creating presentations. It provides a minimalistic editor interface to write slide content in Markdown format, which then gets rendered into an elegant slide deck for presenting.Some key features of Marple:Write slide content in easy-to-read and write Markdown format. Format headings, lists,...
Slemma is an open-source alternative to Grammarly that provides AI-powered grammar and spelling correction for your writing.With Slemma, you can paste in any text and it will analyze it using natural language processing to find typos, grammatical mistakes, and other writing issues. As you type or edit text, Slemma underlines...
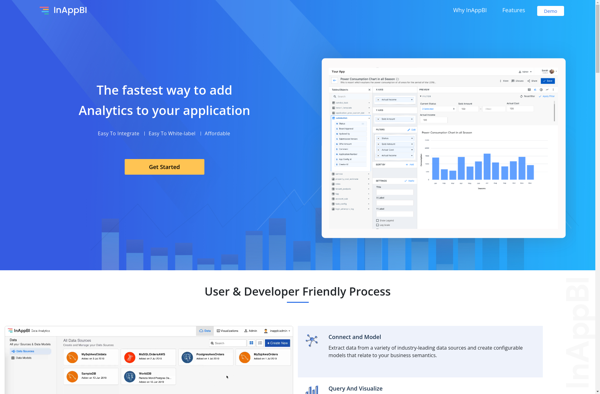
InAppBI is a business intelligence and analytics platform specifically designed for gathering insights from web and mobile applications. It allows developers to instrument their apps to capture event data and user behavior, which is processed by the InAppBI platform to generate interactive analytics dashboards and reports.Key capabilities and benefits of...
Mantle Enterprise Analytics is a robust business intelligence and analytics solution catered towards large enterprises. It provides a wide range of capabilities to collect, store, process, analyze, and visualize data across the organization.Key features include:Interactive dashboards and reports for data visualizationPredictive modeling, forecasting, and machine learning algorithmsConnectors to extract data...
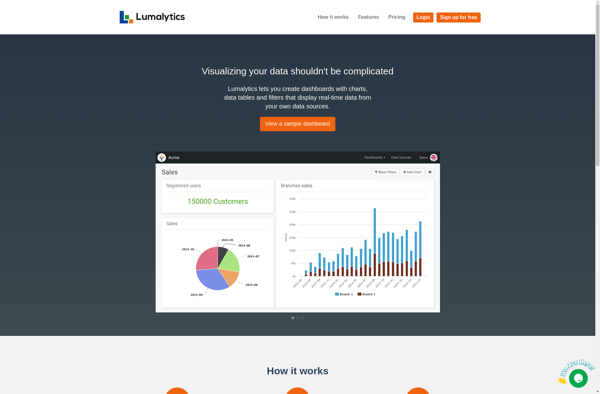
Lumalytics is a software platform built to provide analytics and business intelligence solutions tailored for the logistics industry. It focuses on connecting disparate data sources across the supply chain to give logistics companies enhanced visibility and actionable insights.Key features of Lumalytics include:Shipment tracking & visibility - Real-time tracking of shipments...