InAppBI is a business intelligence and analytics platform designed for use within web and mobile applications. It allows developers to build custom analytics dashboards and reports that provide insights into app usage and customer behavior.
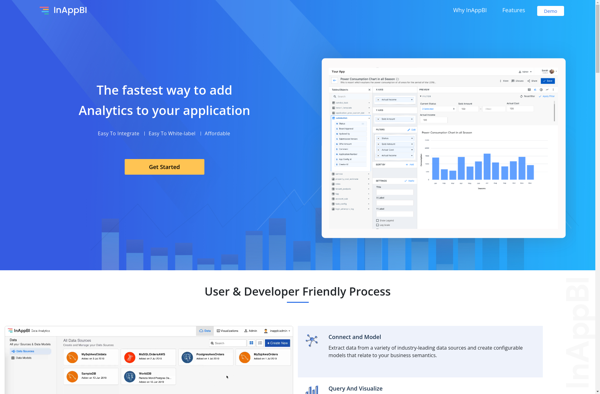
InAppBI: Business Intelligence and Analytics Platform
A customized analytics solution for web and mobile applications, enabling developers to create actionable dashboards and reports on app usage and customer behavior.
What is InAppBI?
InAppBI is a business intelligence and analytics platform specifically designed for gathering insights from web and mobile applications. It allows developers to instrument their apps to capture event data and user behavior, which is processed by the InAppBI platform to generate interactive analytics dashboards and reports.
Key capabilities and benefits of InAppBI include:
Build custom dashboards and reports to analyze app usage, customer engagement, conversion funnels, cohort retention and more
Visualize data in real-time with charts, graphs and KPI widgets
Slice and dice data by various attributes to uncover trends and patterns
Track events and user actions to understand behavior flows and optimize app experiences
Integrates directly inside web and mobile apps for seamless analytics
Offers APIs and developer SDKs to enable tracking and analytics with minimal code changes
Secure and scalable cloud-based platform designed for modern application analytics
Overall, InAppBI makes it easy for app developers to understand their customers and make data-driven decisions to enhance apps and drive better business outcomes.
InAppBI Features
Features
Customizable dashboards and reports
Real-time data analysis
Integrations with various data sources
Drag-and-drop report builder
Automated data processing and visualization
White-label and embedded analytics capabilities
Role-based access controls
Mobile-friendly design
Pricing
Subscription-Based
Pros
Seamless integration with web and mobile apps
Flexible and scalable analytics solution
Extensive customization options
Improved decision-making through data-driven insights
Enhances user engagement and retention
Cons
Steep learning curve for non-technical users
Potential performance issues with large data sets
Limited out-of-the-box data connectors
Pricing may be higher compared to some competitors
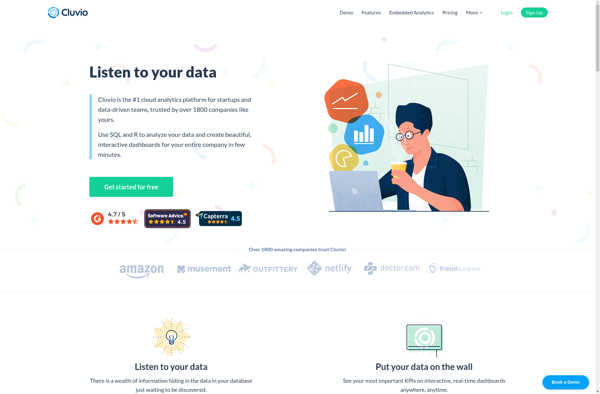
Cluvio is a business intelligence and analytics software designed for small and medium-sized businesses. It aims to make data analytics accessible to non-technical users through an intuitive graphical interface. Some key capabilities and benefits of Cluvio include:Interactive dashboards - Users can create customizable dashboards to visualize important business metrics and...
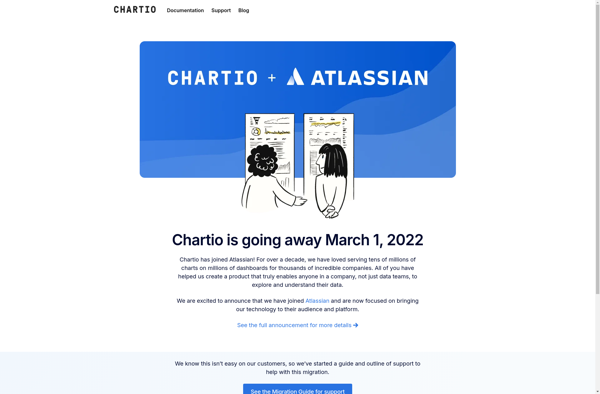
Chartio is a cloud-based business intelligence and data visualization platform designed to help companies analyze data and share actionable insights. It allows users to connect a variety of data sources including databases, cloud apps, and spreadsheets, and build interactive dashboards and charts.Key features of Chartio include:Intuitive drag and drop interface...
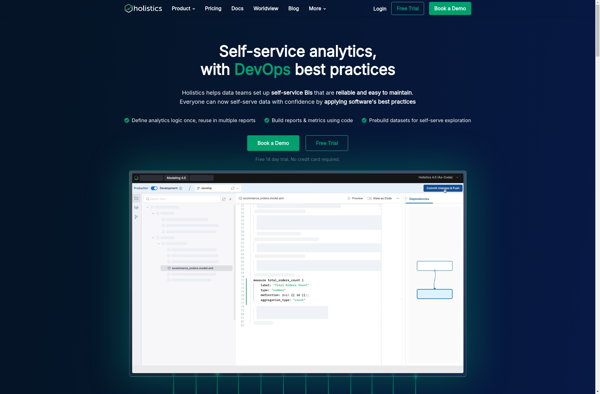
Holistics is an AI-powered unified data platform designed to help companies build and manage their data infrastructure. It provides an intuitive interface for data teams to ingest, prepare, analyze, and visualize data from diverse sources.Key capabilities include:Smart data collection and ingestion from databases, cloud apps, APIs etc.Automated data mapping, cleansing,...
Vizydrop is a comprehensive graphic design and video editing software suitable for entrepreneurs, small business owners, marketers, social media managers, students, and anyone who needs to create visual content.With its drag-and-drop interface, Vizydrop makes graphic design and video creation accessible even for beginners. It has various templates and assets that...
QueryTree is a visual SQL analytics software designed to make query building fast and easy for any skill level. It features an intuitive drag-and-drop interface that allows users to construct complex SQL queries visually without typing code.Some key features of QueryTree include:Visual query builder with drag-and-drop fields and quick type...
Datapine is an easy-to-use business analytics and dashboard software designed to help businesses visualize, analyze and gain insights from their data. It provides powerful tools to access, clean, unify and model data from multiple sources, including SQL and NoSQL databases, cloud apps, spreadsheets, CSV files and more.Key features of Datapine...
Sisense for Cloud Data Teams is a business intelligence and analytics software platform purpose-built for data teams working with cloud data sources like Snowflake, Databricks, AWS, and Google BigQuery. It aims to make analytics over cloud data easy, accurate, and accessible to everyone.Key capabilities and benefits include:Connectors for leading cloud...
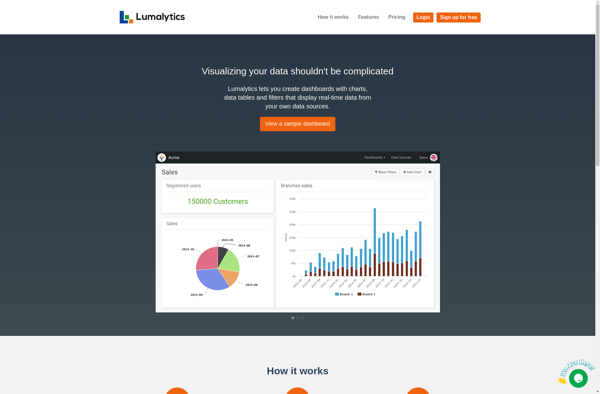
Lumalytics is a software platform built to provide analytics and business intelligence solutions tailored for the logistics industry. It focuses on connecting disparate data sources across the supply chain to give logistics companies enhanced visibility and actionable insights.Key features of Lumalytics include:Shipment tracking & visibility - Real-time tracking of shipments...