QueryTree is a data analytics tool that allows users to visually build SQL queries by dragging and dropping fields into a query tree interface. It eliminates the need to write SQL code manually.
QueryTree: Data Analytics Tool for Visual SQL Query Buildings
QueryTree is a data analytics tool that allows users to visually build SQL queries by dragging and dropping fields into a query tree interface. It eliminates the need to write SQL code manually.
What is QueryTree?
QueryTree is a visual SQL analytics software designed to make query building fast and easy for any skill level. It features an intuitive drag-and-drop interface that allows users to construct complex SQL queries visually without typing code.
Some key features of QueryTree include:
Visual query builder with drag-and-drop fields and quick type ahead search
Supports joining multiple data sources
Advanced filtering, grouping, sorting, and transformations
Save queries for later use and collaboration
Scheduled refresh of query results
Export results to CSV or JSON
Integrations with databases like MySQL, Postgres, BigQuery, and more
Secure data access controls and auditing
Cloud-based with collaborative sharing and Slack notifications
By eliminating the need to hand-code SQL, QueryTree allows users of any technical skill level to harness the power of their data. Its intuitive visual interface and extensive features make QueryTree a versatile solution for business analysts, data scientists, and developers alike.
QueryTree Features
Features
Drag-and-drop query builder
Automatic SQL generation
Supports multiple data sources
Visualization of query results
Collaboration and sharing features
Version history and change tracking
Pricing
Freemium
Subscription-Based
Pros
Intuitive and user-friendly interface
Eliminates the need for manual SQL writing
Supports a wide range of data sources
Collaborative features for team-based analysis
Provides visual feedback on query structure
Cons
Limited customization options for advanced users
Potential performance issues with large datasets
Learning curve for users unfamiliar with SQL concepts
Microsoft Power BI is a powerful business analytics service developed by Microsoft. It empowers users to transform raw data into meaningful insights, create interactive reports and dashboards, and share data-driven stories within an organization. Power BI is designed to help businesses and individuals make informed decisions based on a comprehensive...
Tableau is a leading business intelligence and data visualization platform used by organizations of all sizes to transform their data into easy-to-understand visualizations and dashboards. With Tableau, users can connect to a wide range of data sources, prepare and clean the data for analysis, and create interactive data visualizations such...
QlikView is a business intelligence and data visualization platform used to create interactive dashboards and analytics applications. It was first released in 1993 by the Swedish company Qlik. Key features of QlikView include:Associative data modeling and in-memory analytics engine - Allows fast analysis of large, disparate datasets without predefined schema...
Funnelytics is a comprehensive marketing analytics platform designed to help businesses visualize and optimize their conversion funnels and customer journeys. It integrates data from multiple sources like websites, ads, CRM systems, etc. to create a single customer view.Key features of Funnelytics include:Interactive conversion funnel analysis to identify sticking points and...
Pentaho is a comprehensive open source business intelligence (BI) suite that provides a range of data integration, analytics, visualization, reporting, data mining, and workflow capabilities. It is designed to help businesses consolidate data from disparate sources for unified analytics and reporting.Some of the key capabilities and components of Pentaho include:Data...
SAP BusinessObjects is a comprehensive business intelligence and analytics software suite from SAP. It brings together capabilities for reporting, analysis, dashboards, data visualization, data discovery, and more to help organizations unlock value from their data.Key capabilities and components of SAP BusinessObjects include:Centralized semantic layer for consistent data across the organizationPowerful...
Sisense is a business intelligence and data analytics software platform designed to help non-technical users prepare, analyze and visualize complex data. Some key features of Sisense include:Intuitive drag-and-drop interface for building interactive dashboards and visualizations like charts, graphs and pivot tables without coding.Ability to connect to wide variety of data...
Amazon QuickSight is a fast, cloud-powered business intelligence service that makes it easy to build visualizations, perform ad-hoc analysis, and quickly get business insights from your data. Some key features include:Intuitive visual interface that makes it easy to visualize and explore dataBroad data connectivity to connect to data sources like...
Jedox is a comprehensive business intelligence and corporate performance management platform designed for mid-size to large enterprises. It provides a wide range of capabilities including:Multi-dimensional online analytical processing (OLAP) for complex data analysis and modelingPlanning, budgeting, and forecasting features for financial planning and simulationCustomizable dashboards and self-service reporting for business...
dotnet Report Builder is an open-source reporting tool designed specifically for .NET applications. It allows .NET developers to create rich, customizable reports for both web and desktop applications with minimal coding.Some key features of dotnet Report Builder include:Supports connecting to various data sources like SQL Server, Oracle, MongoDB, REST APIs,...
Vizydrop is a comprehensive graphic design and video editing software suitable for entrepreneurs, small business owners, marketers, social media managers, students, and anyone who needs to create visual content.With its drag-and-drop interface, Vizydrop makes graphic design and video creation accessible even for beginners. It has various templates and assets that...
ReportServer is an open source business intelligence and reporting platform used to create and distribute interactive reports and dashboards. It supports connecting to various relational and NoSQL databases, flat files, REST APIs, and other data sources to build reports.Some key capabilities and benefits of ReportServer include:Ad-hoc reporting for business users...
Windward Core is a document generation and reporting engine that can be licensed and integrated into other applications that need advanced document creation and editing capabilities.It provides a full featured template design interface that allows users to easily create complex, data-powered documents without any programming. Templates can include text, images,...
Marple is an open-source, Markdown-based slide deck tool for creating presentations. It provides a minimalistic editor interface to write slide content in Markdown format, which then gets rendered into an elegant slide deck for presenting.Some key features of Marple:Write slide content in easy-to-read and write Markdown format. Format headings, lists,...
InfoCaptor Dashboard is a business intelligence and analytics platform designed to help companies consolidate their data, create customized dashboards and reports, and uncover valuable insights. Some key features of InfoCaptor Dashboard include:Data connectivity and ETL - Connect to data from multiple sources like SQL and NoSQL databases, cloud apps, Excel,...
Teradata is a leading enterprise data warehousing solution designed for large-scale data storage, management, and analysis. It leverages parallel processing and advanced database design to enable high-performance analytics on petabyte-scale data volumes.Some key capabilities and benefits of Teradata include:Massive scalability and storage capacity for storing hundreds of terabytes to petabytes...
DigDash Enterprise is a feature-rich business intelligence and analytics platform tailored for large enterprises. It enables organizations to aggregate data from multiple sources, gain actionable insights, and make data-driven decisions.Key capabilities include:Data connectivity - Connect to 100+ data sources such as databases, cloud apps, big data platforms, etc. Integrates nicely...
Slemma is an open-source alternative to Grammarly that provides AI-powered grammar and spelling correction for your writing.With Slemma, you can paste in any text and it will analyze it using natural language processing to find typos, grammatical mistakes, and other writing issues. As you type or edit text, Slemma underlines...
XLCubed is an Excel add-in designed specifically for financial analysts and modelers. It enhances Excel by providing commonly used financial functions, keyboard shortcuts, flexible graphing tools, and auditing features to improve model quality.Some of the key features of XLCubed include:Hundreds of financial and math functions like IRR, XNPV, XIRR, and...
Datawatch is a business intelligence and analytics platform designed for self-service data preparation, reporting and visualization. Some key capabilities and features of Datawatch include:Data Connectivity - Datawatch can connect to a wide variety of data sources like databases, applications, flat files, big data platforms and more. It provides connectivity to...
Cortana Analytics is an integrated suite of intelligence tools and services from Microsoft designed to help organizations make data-driven decisions. It includes the following core components:Azure Machine Learning - A cloud service for building and deploying predictive analytics solutions and machine learning modelsHDInsight - Managed Hadoop, Spark, and other big...
Salford Systems is a San Diego-based software company founded in 1983 that develops advanced analytics and data mining software. Their main products include:CART - classification and regression tree algorithm softwareMARS - multivariate adaptive regression splines modelingTreeNet - stochastic gradient boosting and random forestsRandom Forests - ensemble learning method for classification...
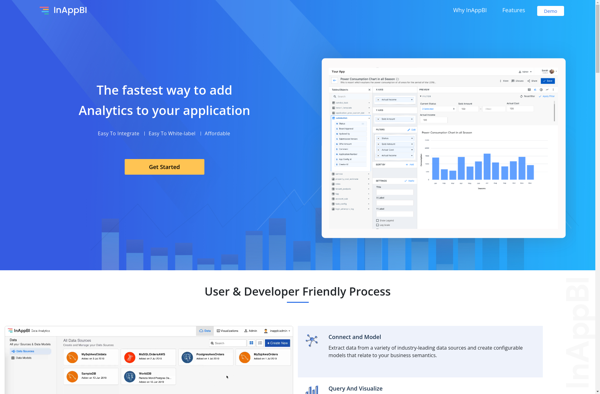
InAppBI is a business intelligence and analytics platform specifically designed for gathering insights from web and mobile applications. It allows developers to instrument their apps to capture event data and user behavior, which is processed by the InAppBI platform to generate interactive analytics dashboards and reports.Key capabilities and benefits of...
Analyza is a business intelligence and data analytics software platform designed to help companies make data-driven decisions. It provides tools for data preparation, interactive visualization, dashboarding, reporting, and predictive analytics.Key features of Analyza include:Intuitive drag-and-drop interface for building dashboards and reports without codingHundreds of customizable data visualization options including charts,...
Prognoz is a comprehensive business forecasting and predictive analytics platform designed to help organizations improve forecast accuracy and operational efficiency. It leverages sophisticated artificial intelligence algorithms, time series analysis, simulation modeling, and machine learning techniques to uncover patterns in historical data and generate accurate demand forecasts.Key features of Prognoz include:Intuitive...
Centius Qi is an intuitive, code-free business automation platform powered by artificial intelligence. It helps companies eliminate manual processes, automate repetitive tasks, and streamline workflows across the organization.With an easy-to-use drag and drop interface, Centius allows anyone to build workflows, set up integrations, create intelligent chatbots, gather actionable insights from...
Lumalytics is a software platform built to provide analytics and business intelligence solutions tailored for the logistics industry. It focuses on connecting disparate data sources across the supply chain to give logistics companies enhanced visibility and actionable insights.Key features of Lumalytics include:Shipment tracking & visibility - Real-time tracking of shipments...
Progress OpenEdge is a development platform optimized for creating business applications. It includes a 4th generation programming language (4GL) designed for rapid application development along with tools for building user interfaces, reporting, integration, and application management.Key features of Progress OpenEdge include:4GL language for faster coding and reduced maintenance costs compared...
Soley Studio is an open-source modeling tool for creating UML diagrams and Business Process Model and Notation (BPMN) workflows. It provides a comprehensive environment for software design and business process modeling.With its simple and intuitive graphical interface, Soley Studio makes it easy to build various diagrams such as use case...
Jolicharts is a feature-rich JavaScript charting library that allows you to easily add interactive charts and graphs to web applications and dashboards. With Jolicharts, you can create over 30 types of charts including line charts, bar charts, pie charts, scatter plots, stacked bar charts and more.Some key features of Jolicharts...
KPI Watchdog is a robust business intelligence and data analytics platform designed to help companies track, analyze, and visualize key performance indicators (KPIs) in real-time. It provides powerful, customizable dashboards and reporting tools to monitor essential metrics across all departments and roles.With KPI Watchdog, businesses can connect data from multiple...
Pyramid Analytics is an advanced business intelligence and analytics platform designed to empower organizations to make faster, more informed decisions. It combines governed self-service analytics capabilities with artificial intelligence-powered features to enable employees to easily access, explore, and act on governed data.Key capabilities of Pyramid Analytics include:Unified governed self-service analytics...