Datawatch
Datawatch is a data analytics and visualization software that allows users to connect to various data sources, prepare and transform data, and create interactive dashboards and reports. It provides self-service data prep and visualization capabilities for business users.

Datawatch: Data Analytics and Visualization Software
Connect to various data sources, prepare and transform data, create interactive dashboards and reports, and gain self-service data prep and visualization capabilities for business users.
What is Datawatch?
Datawatch is a business intelligence and analytics platform designed for self-service data preparation, reporting and visualization. Some key capabilities and features of Datawatch include:
- Data Connectivity - Datawatch can connect to a wide variety of data sources like databases, applications, flat files, big data platforms and more. It provides connectivity to both on-premises and cloud data.
- Data Preparation - The software includes self-service data wrangling and manipulation capabilities like joining data from multiple sources, cleaning, transforming and enriching data.
- Interactive Visualizations - Users can create rich, interactive dashboards, reports and visualizations to gain insights from data. A variety of charts, graphs and geospatial visuals are supported.
- Self-Service Model - Datawatch enables a self-service BI approach so business users can prepare and analyze data without relying on IT or data experts.
- On-premises and Cloud Deployment Options - Organizations can use Datawatch either as an on-premises software or via the cloud as a SaaS platform.
Overall, Datawatch positions itself as an agile, self-service solution to accelerate time to insight across an organization's data landscape.
Datawatch Features
Features
- Data connectivity to various sources
- Self-service data preparation
- Interactive data visualization
- Ad hoc reporting
- Scheduled report distribution
Pricing
- Subscription-Based
Pros
Intuitive drag-and-drop interface
Pre-built data connectors
Powerful data transformation capabilities
Interactive visualizations and dashboards
Can handle large and complex datasets
Cons
Steep learning curve
Limited advanced analytics capabilities
Exporting options could be better
Can be resource intensive for large datasets
Official Links
Reviews & Ratings
Login to ReviewThe Best Datawatch Alternatives
View all Datawatch alternatives with detailed comparison →
Top Business & Commerce and Business Intelligence & Analytics and other similar apps like Datawatch
Here are some alternatives to Datawatch:
Suggest an alternative ❐Tableau
Tableau is a leading business intelligence and data visualization platform used by organizations of all sizes to transform their data into easy-to-understand visualizations and dashboards. With Tableau, users can connect to a wide range of data sources, prepare and clean the data for analysis, and create interactive data visualizations such...

QlikView
QlikView is a business intelligence and data visualization platform used to create interactive dashboards and analytics applications. It was first released in 1993 by the Swedish company Qlik. Key features of QlikView include:Associative data modeling and in-memory analytics engine - Allows fast analysis of large, disparate datasets without predefined schema...

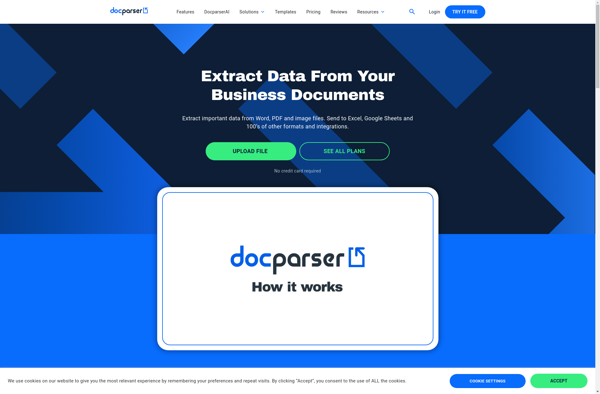
Docparser
Docparser is a cloud-based document parsing and data extraction API. It allows developers to build document processing workflows to extract data from invoices, receipts, resumes, contracts and many other document types.The key capabilities and benefits of Docparser include:Machine learning powered data extraction - Docparser uses advanced machine learning and computer...
Sisense
Sisense is a business intelligence and data analytics software platform designed to help non-technical users prepare, analyze and visualize complex data. Some key features of Sisense include:Intuitive drag-and-drop interface for building interactive dashboards and visualizations like charts, graphs and pivot tables without coding.Ability to connect to wide variety of data...

Amazon QuickSight
Amazon QuickSight is a fast, cloud-powered business intelligence service that makes it easy to build visualizations, perform ad-hoc analysis, and quickly get business insights from your data. Some key features include:Intuitive visual interface that makes it easy to visualize and explore dataBroad data connectivity to connect to data sources like...

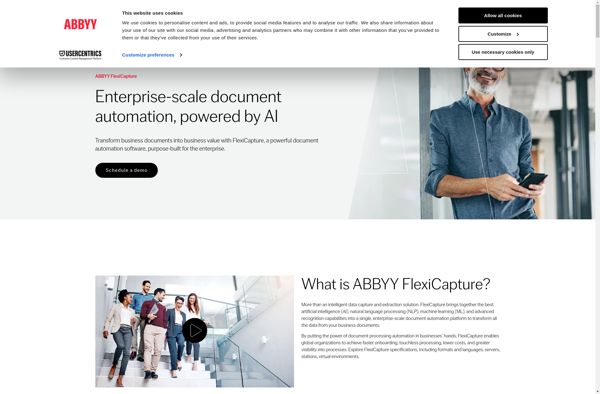
ABBYY FlexiCapture
ABBYY FlexiCapture is an intelligent data capture and document processing platform designed to help organizations automate the conversion of forms and documents into business-ready data.It utilizes optical character recognition (OCR), artificial intelligence (AI), and machine learning technologies to automatically capture and extract text, images, barcodes, and field data from documents...
QueryTree
QueryTree is a visual SQL analytics software designed to make query building fast and easy for any skill level. It features an intuitive drag-and-drop interface that allows users to construct complex SQL queries visually without typing code.Some key features of QueryTree include:Visual query builder with drag-and-drop fields and quick type...

Marple
Marple is an open-source, Markdown-based slide deck tool for creating presentations. It provides a minimalistic editor interface to write slide content in Markdown format, which then gets rendered into an elegant slide deck for presenting.Some key features of Marple:Write slide content in easy-to-read and write Markdown format. Format headings, lists,...

KiniMetrix
KiniMetrix is a cloud-based software platform designed for healthcare providers to help them better manage their practices, engage with patients, gain population health insights, and handle administrative tasks. It combines features typically found in separate electronic health record (EHR), practice management, patient portal and business intelligence solutions into one unified...
Zylotech
Zylotech is an emerging no-code AI platform designed to make AI accessible to everyone regardless of technical skillset. The platform provides an intuitive visual interface using building blocks to develop AI models without writing any code.Some key capabilities of Zylotech include:Drag-and-drop interface to build end-to-end AI workflows from data ingestion...

Infrrd OCR
Infrrd OCR is an advanced optical character recognition and data capture platform used to digitize and extract information from scanned documents, PDFs, and images. It utilizes AI and machine learning for highly accurate text, layout, and data recognition across over 60 languages.Key features of Infrrd OCR include:Industry-leading OCR accuracy rates...
Owlata
Owlata is a customer data platform (CDP) and marketing automation software designed to help B2C companies collect customer data from all touchpoints, build unified customer profiles, derive actionable insights, and orchestrate personalized omnichannel campaigns.Key capabilities and benefits include:Unified Customer Profiles - Consolidate customer data from all online and offline sources...
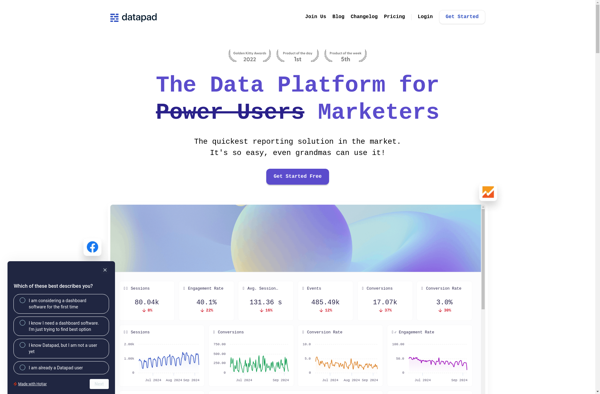
DataPad
DataPad is a user-friendly data analysis and visualization software designed for researchers of all levels. With its intuitive drag-and-drop interface, DataPad allows users to easily import, clean, analyze and visualize complex datasets without coding.Key features include:Import data from CSV, Excel, databases and other sourcesInteractive drag-and-drop workflow to clean, analyze and...
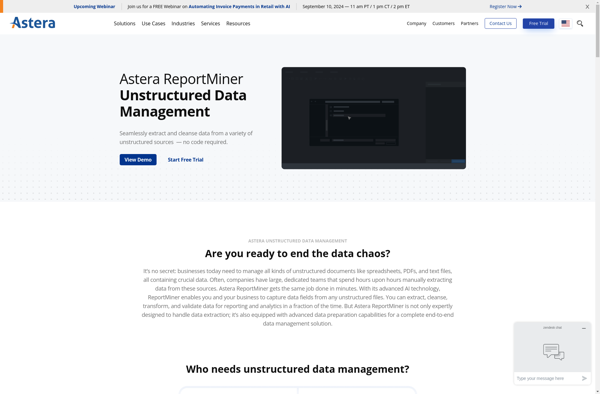
Astera ReportMiner
Astera ReportMiner is a self-service data preparation and reporting solution designed for business users and analysts. It provides an intuitive graphical interface to easily combine and transform data from multiple sources like databases, cloud apps, Excel, JSON and CSV files.Key capabilities and benefits include:Intuitive drag-and-drop interface to blend, clean, transform...