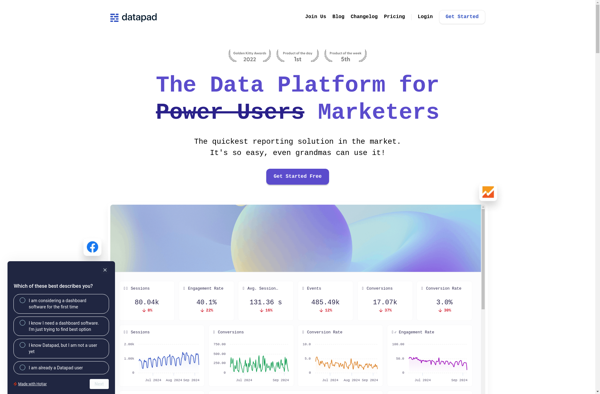
DataPad is a data analysis tool for researchers to easily visualize, explore, analyze and publish datasets. Its intuitive drag-and-drop interface allows users to quickly generate charts, maps, tables and dashboards.
DataPad is a data analysis tool for researchers to easily visualize, explore, analyze and publish datasets. Its intuitive drag-and-drop interface allows users to quickly generate charts, maps, tables and dashboards.
What is DataPad?
DataPad is a user-friendly data analysis and visualization software designed for researchers of all levels. With its intuitive drag-and-drop interface, DataPad allows users to easily import, clean, analyze and visualize complex datasets without coding.
Key features include:
Import data from CSV, Excel, databases and other sources
Interactive drag-and-drop workflow to clean, analyze and visualize data
Library of 30+ chart types including maps, histograms, heatmaps, scatter plots
Collaboration tools to share analyses and data with team members
Auto-generate interactive dashboards and reports
One-click export and publishing of charts, dashboards and underlying data
Whether working with survey data, financial data, network data or any other dataset, DataPad provides researchers powerful self-serve analytics to gain rapid insights. Its ease-of-use and versatility makes DataPad suitable for users across industries like academia, marketing, business intelligence, public policy and more.
Tableau is a leading business intelligence and data visualization platform used by organizations of all sizes to transform their data into easy-to-understand visualizations and dashboards. With Tableau, users can connect to a wide range of data sources, prepare and clean the data for analysis, and create interactive data visualizations such...
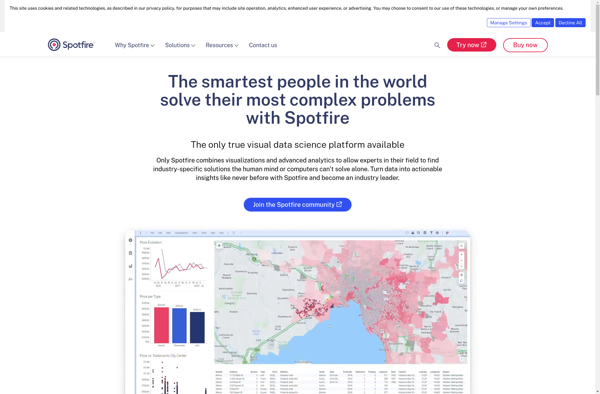
Spotfire is a business intelligence and analytics software platform designed for interactive data discovery and visualization. It enables rapid analysis of large, complex data sets to uncover deeper insights.Key features of Spotfire include:Interactive dashboards and visualizations - Drag-and-drop interface to create customized data visualizations like heat maps, charts, graphs, and...
Redash is an open-source business intelligence and data visualization web application. It allows users to connect to multiple data sources including SQL databases, query and visualize the data, and create interactive dashboards to share insights.Some key features of Redash:Connect to data sources like PostgreSQL, MySQL, SQL Server, Redshift, BigQuery and...
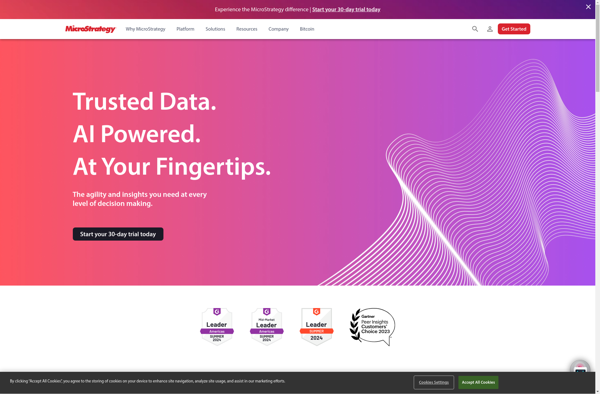
MicroStrategy is a leading enterprise analytics platform designed to help organizations make data-driven business decisions through advanced visualization and dashboarding capabilities. It serves as a one-stop solution for BI, allowing for data preparation, discovery, reporting, and predictive analytics.Key features of MicroStrategy include:Interactive dashboards and pixel-perfect reports that can be accessed...
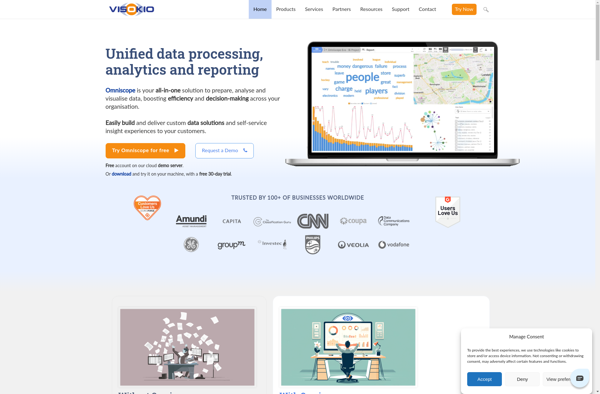
Omniscope is a new, highly customizable web browser that aims to provide the best features of various popular browsers in one package. It is based on the Chromium engine but includes additional functionality inspired by Opera, Vivaldi, Brave and Firefox.Some key features of Omniscope include:Customizable interface - Users can tweak...
Marple is an open-source, Markdown-based slide deck tool for creating presentations. It provides a minimalistic editor interface to write slide content in Markdown format, which then gets rendered into an elegant slide deck for presenting.Some key features of Marple:Write slide content in easy-to-read and write Markdown format. Format headings, lists,...
Zoho Analytics is a powerful yet user-friendly business intelligence and data analytics platform used by organizations of all sizes. It allows you to connect data from multiple sources including databases, cloud apps, and files, enabling a unified view of business data.With an intuitive drag-and-drop interface, Zoho Analytics makes it easy...
Stagraph is a powerful yet easy-to-use data visualization and analytics platform designed for modern business needs. As a cloud-based solution, Stagraph enables users to effortlessly map, analyze, and gain actionable insights from even the most complex data sets through intuitive drag-and-drop visualizations.Key capabilities and benefits include:Intelligible and interactive data visualizations...
Datacopia is an open-source data workflow and pipeline tool designed for integrating, moving, and transforming data across databases, data warehouses, lakes, and other systems. It provides an easy to use visual interface to build and manage complex data pipelines without coding.Key features of Datacopia include:Visual data pipeline designer to model...
Birst is a cloud-native business intelligence and analytics platform used by enterprises to unify, understand, and act on data. Key capabilities and benefits include:Cloud data warehousing to bring together data from multiple sources for analysisInteractive dashboards and visualizations to spot trends and insightsSelf-service analytics empowering users across the organization to...
Datawatch is a business intelligence and analytics platform designed for self-service data preparation, reporting and visualization. Some key capabilities and features of Datawatch include:Data Connectivity - Datawatch can connect to a wide variety of data sources like databases, applications, flat files, big data platforms and more. It provides connectivity to...
Cortana Analytics is an integrated suite of intelligence tools and services from Microsoft designed to help organizations make data-driven decisions. It includes the following core components:Azure Machine Learning - A cloud service for building and deploying predictive analytics solutions and machine learning modelsHDInsight - Managed Hadoop, Spark, and other big...
Planchette Online is a free web-based Ouija board experience that allows users to have a simulated séance without needing to purchase a physical Ouija board. Users simply visit the Planchette Online website and are greeted with a realistic 3D rendering of a classic Ouija board on a wooden table.To start...
bipp Analytics is a business intelligence and data visualization software that empowers users to connect their data, analyze it visually, and extract meaningful insights. Some key features of bipp Analytics include:Data Connectors - Connect your data from databases, cloud apps, Excel, etc. with pre-built connectors.Interactive Dashboards - Build visually appealing,...