Bipp Analytics
bipp Analytics is a business intelligence and data visualization platform that allows users to connect data from multiple sources, create interactive dashboards and reports, and gain actionable insights. It features an easy-to-use drag and drop interface.

bipp Analytics: Business Intelligence & Data Visualization Platform
Connect data from multiple sources, create interactive dashboards and reports, and gain actionable insights with bipp Analytics' easy-to-use drag and drop interface.
What is Bipp Analytics?
bipp Analytics is a business intelligence and data visualization software that empowers users to connect their data, analyze it visually, and extract meaningful insights. Some key features of bipp Analytics include:
- Data Connectors - Connect your data from databases, cloud apps, Excel, etc. with pre-built connectors.
- Interactive Dashboards - Build visually appealing, interactive dashboards and reports using a simple drag-and-drop interface.
- Ad hoc Analysis - Quickly analyze your data on-the-fly without relying on analysts or IT teams.
- Data Visualizations - Choose from a variety of charts, maps, gauges and more to visualize your data.
- Collaboration Tools - Annotate, discuss insights, and share dashboards across your organization.
- Alerts and Notifications - Get automatically notified when key metrics cross thresholds.
- API and Integration - Integrate bipp seamlessly into other platforms and applications.
With its user-friendly interface, robust feature set and secure infrastructure, bipp enables organizations to democratize data access and visualization for better, faster decision making.
Bipp Analytics Features
Features
- Drag-and-drop interface for building dashboards
- Connect to data sources like SQL, MongoDB, REST APIs
- Interactive visualizations like charts, graphs, maps
- Scheduled reports and alerts
- Collaboration tools for sharing insights
- Mobile app for access on the go
Pricing
- Freemium
- Subscription-Based
Pros
Intuitive and easy to use
Great for non-technical users
Scales to large data volumes
Many integration options
Good value for money
Cons
Steep learning curve for advanced features
Limited customization options
Can be slow with complex data models
Lacks some advanced analytics capabilities
Official Links
Reviews & Ratings
Login to ReviewThe Best Bipp Analytics Alternatives
View all bipp Analytics alternatives with detailed comparison →
Top Business & Commerce and Business Intelligence & Analytics and other similar apps like Bipp Analytics
Here are some alternatives to Bipp Analytics:
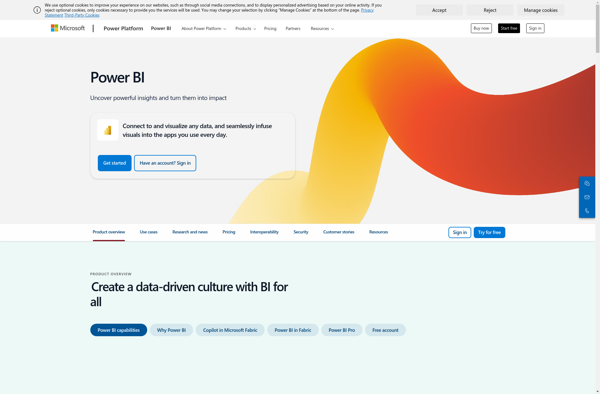
Suggest an alternative ❐Microsoft Power BI
Microsoft Power BI is a powerful business analytics service developed by Microsoft. It empowers users to transform raw data into meaningful insights, create interactive reports and dashboards, and share data-driven stories within an organization. Power BI is designed to help businesses and individuals make informed decisions based on a comprehensive...

Tableau
Tableau is a leading business intelligence and data visualization platform used by organizations of all sizes to transform their data into easy-to-understand visualizations and dashboards. With Tableau, users can connect to a wide range of data sources, prepare and clean the data for analysis, and create interactive data visualizations such...

Looker Studio
Looker Studio is a business intelligence and analytics platform designed to help companies analyze data and gain valuable insights. It provides an intuitive, web-based interface that enables users without technical skills to explore, visualize and share data easily.Some key capabilities and benefits of Looker Studio include:Interactive dashboards - Users can...

Google Charts
Google Charts is a robust and flexible JavaScript charting and data visualization library provided for free by Google. It offers developers a highly customizable way to create interactive charts, graphs, and data tables that seamlessly integrate into web pages and applications.With Google Charts, you can visualize complex data sets and...

Pentaho
Pentaho is a comprehensive open source business intelligence (BI) suite that provides a range of data integration, analytics, visualization, reporting, data mining, and workflow capabilities. It is designed to help businesses consolidate data from disparate sources for unified analytics and reporting.Some of the key capabilities and components of Pentaho include:Data...

Plotly
Plotly is an open-source graphing library that allows users to create interactive, publication-quality graphs, charts, and dashboards. It supports Python, R, JavaScript, and Excel as programming languages. Some key features of Plotly include:Interactive visualization - Plotly charts are interactive with features like hover text, zooming, panning, selectable legends, and editable...

Retool
Retool is a low-code development platform designed to help teams build internal tools and business applications faster. It provides an easy-to-use drag and drop interface that allows you to quickly build workflows, forms, charts, kanban boards and more without needing to write any code.Some key features of Retool include:Connects to...
Widestage
Widestage is an enterprise-grade platform for live video streaming, webinars, and webcasts. It enables businesses, event organizers, education institutions and media publishers to easily broadcast content in real-time to engage with their audience.Key features of Widestage include:Intuitive dashboards for managing live events, presenters, registration, and branding.Robust viewing portal allowing viewers...
Redash
Redash is an open-source business intelligence and data visualization web application. It allows users to connect to multiple data sources including SQL databases, query and visualize the data, and create interactive dashboards to share insights.Some key features of Redash:Connect to data sources like PostgreSQL, MySQL, SQL Server, Redshift, BigQuery and...

Amazon QuickSight
Amazon QuickSight is a fast, cloud-powered business intelligence service that makes it easy to build visualizations, perform ad-hoc analysis, and quickly get business insights from your data. Some key features include:Intuitive visual interface that makes it easy to visualize and explore dataBroad data connectivity to connect to data sources like...

Databox
Databox is an open-source personal data platform that enables individuals to manage their personal data securely and privately. Developed by researchers at Imperial College London and the University of Cambridge, Databox allows users to connect data sources like smartphones, wearables, and web apps to feed data into the platform.Once data...
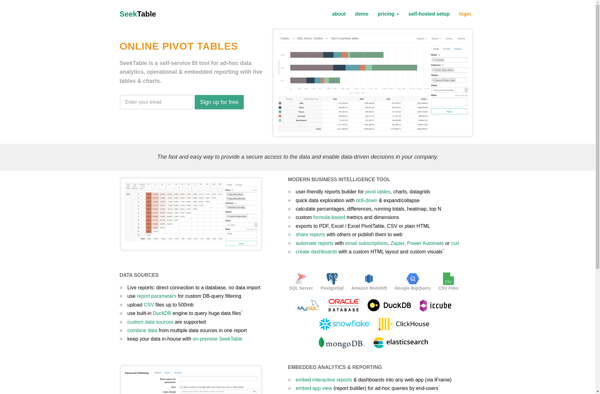
SeekTable
SeekTable is a browser extension and web app that helps you navigate websites more efficiently. It works by outlining tables, charts, and graphs on web pages so you can easily scan, search, and summarize data.Once installed, SeekTable will detect tables, charts, and graphs on a web page and draw red...
Angoss KnowledgeSEEKER
Angoss KnowledgeSEEKER is a comprehensive data mining and predictive analytics platform used to uncover patterns and relationships in data to improve decision making. It helps organizations leverage their data by providing capabilities for:Data preparation and cleansing - KnowledgeSEEKER provides tools to profile, cleanse, transform, aggregate, sample, and partition data to...

Marple
Marple is an open-source, Markdown-based slide deck tool for creating presentations. It provides a minimalistic editor interface to write slide content in Markdown format, which then gets rendered into an elegant slide deck for presenting.Some key features of Marple:Write slide content in easy-to-read and write Markdown format. Format headings, lists,...

GGobi
GGobi is an open-source, multi-platform software application for interactive exploratory data analysis. It allows users to visualize high-dimensional datasets by leveraging interactive graphics such as scatterplots, parallel coordinates, star glyphs, time series plots, tours (animation sequences for exploring n-dimensional data spaces), as well as dimension reduction techniques like principal components...
ShopIQ
ShopIQ is an ecommerce business intelligence and reporting platform designed to help online retailers make better data-driven decisions. It provides a centralized dashboard that imports data automatically from popular ecommerce platforms like Shopify to provide insights into sales, inventory, customers, marketing analytics, and more.Key features of ShopIQ include:Dashboards and reports...
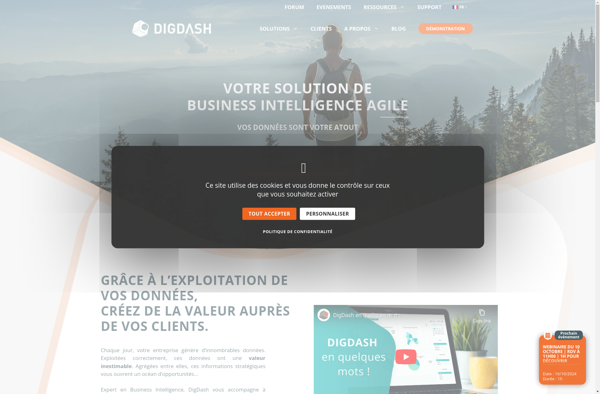
DigDash Enterprise
DigDash Enterprise is a feature-rich business intelligence and analytics platform tailored for large enterprises. It enables organizations to aggregate data from multiple sources, gain actionable insights, and make data-driven decisions.Key capabilities include:Data connectivity - Connect to 100+ data sources such as databases, cloud apps, big data platforms, etc. Integrates nicely...
Dotmatics Vortex
Dotmatics Vortex is a scientific informatics software platform used by pharmaceutical, biotechnology, and other research organizations to efficiently capture, store, analyze, and share chemical and biological data.Key features of Dotmatics Vortex include:Chemical registration system to store and search compounds and associated dataBio registration system to store and search biological entities...
RAWGraphs
RAWGraphs is a free, open-source web tool created for anyone to easily visualize and share data using the most common graphical formats. The simple drag and drop interface makes it easy for non-experts to quickly generate a wide variety of charts and diagrams that can be exported and shared as...

XLCubed
XLCubed is an Excel add-in designed specifically for financial analysts and modelers. It enhances Excel by providing commonly used financial functions, keyboard shortcuts, flexible graphing tools, and auditing features to improve model quality.Some of the key features of XLCubed include:Hundreds of financial and math functions like IRR, XNPV, XIRR, and...
AVORA
AVORA is a free, open-source video conferencing software designed for online meetings, webinars, remote teaching and other collaborative tasks. It provides high-quality audio and video communication in a customizable virtual meeting space.Some key features of AVORA include:Real-time HD video and crystal clear audio for natural conversationsScreen sharing to present slides,...
Salford Systems
Salford Systems is a San Diego-based software company founded in 1983 that develops advanced analytics and data mining software. Their main products include:CART - classification and regression tree algorithm softwareMARS - multivariate adaptive regression splines modelingTreeNet - stochastic gradient boosting and random forestsRandom Forests - ensemble learning method for classification...
Quadrigram
Quadrigram is an open-source grammar, spelling, and style checking software. It was created as an alternative to commercial options like Grammarly or Microsoft Editor. Quadrigram analyzes written text and uses natural language processing and machine learning algorithms to detect grammar, spelling, punctuation, and other stylistic issues.Key features of Quadrigram include:Grammar...
Palantir Metropolis
Palantir Metropolis is a powerful data management and analytics platform developed by Palantir Technologies. It is designed to help organizations integrate, manage, analyze, and act on massive amounts of disparate data.Some key capabilities of Metropolis include:Data integration - Ingest, standardize, and connect data across siloed sources into a common data...
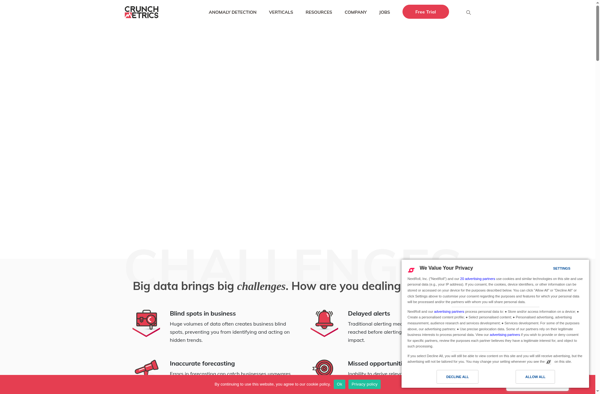
CrunchMetrics
CrunchMetrics is a business intelligence and data analytics software platform aimed at helping companies make data-driven decisions. It allows users to connect to various data sources, clean and transform data, and create interactive dashboards and reports to gain insights.Key features of CrunchMetrics include:Drag-and-drop interface to build dashboards with charts, tables,...
YellowFin
YellowFin is an open-source autoML library for Python that automates the tuning of hyperparameters and model architecture search to help users achieve high accuracy with machine learning models. Developed by researchers at MIT, IIT, and Adobe Research, YellowFin aims to make state-of-the-art machine learning techniques accessible to non-experts.Some key capabilities...

Mantle Enterprise Analytics
Mantle Enterprise Analytics is a robust business intelligence and analytics solution catered towards large enterprises. It provides a wide range of capabilities to collect, store, process, analyze, and visualize data across the organization.Key features include:Interactive dashboards and reports for data visualizationPredictive modeling, forecasting, and machine learning algorithmsConnectors to extract data...
ProClarity
ProClarity is a business intelligence and analytics software designed to help organizations make data-driven decisions. It provides an interactive dashboard and data visualization capabilities to easily analyze large datasets from multiple sources.Key features of ProClarity include:Drag-and-drop interface to quickly build dashboards and visualizationsBroad connectivity to import data from SQL Server,...
Progress OpenEdge
Progress OpenEdge is a development platform optimized for creating business applications. It includes a 4th generation programming language (4GL) designed for rapid application development along with tools for building user interfaces, reporting, integration, and application management.Key features of Progress OpenEdge include:4GL language for faster coding and reduced maintenance costs compared...
JReport
JReport is a business intelligence and reporting tool used to create interactive reports and dashboards from multiple data sources. It has an easy-to-use drag-and-drop interface that allows non-technical users to quickly build reports and visualize data without coding.Some key features of JReport include:Connecting to various databases, cloud apps, big data...
Soley Studio
Soley Studio is an open-source modeling tool for creating UML diagrams and Business Process Model and Notation (BPMN) workflows. It provides a comprehensive environment for software design and business process modeling.With its simple and intuitive graphical interface, Soley Studio makes it easy to build various diagrams such as use case...
Owlata
Owlata is a customer data platform (CDP) and marketing automation software designed to help B2C companies collect customer data from all touchpoints, build unified customer profiles, derive actionable insights, and orchestrate personalized omnichannel campaigns.Key capabilities and benefits include:Unified Customer Profiles - Consolidate customer data from all online and offline sources...
Bouquet
Bouquet is an open-source and free office suite that provides alternatives to Microsoft Office apps like Word, Excel, and PowerPoint. It includes a word processor, spreadsheet program, and presentation software that allows users to create, edit, and share documents, spreadsheets, and slide decks.The word processor, Bouquet Words, provides similar functionality...
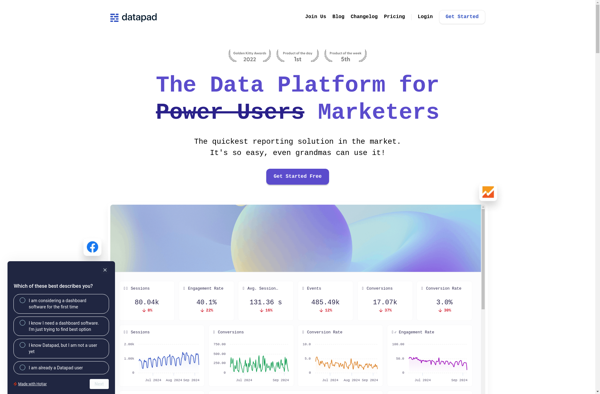
DataPad
DataPad is a user-friendly data analysis and visualization software designed for researchers of all levels. With its intuitive drag-and-drop interface, DataPad allows users to easily import, clean, analyze and visualize complex datasets without coding.Key features include:Import data from CSV, Excel, databases and other sourcesInteractive drag-and-drop workflow to clean, analyze and...
Pyramid Analytics
Pyramid Analytics is an advanced business intelligence and analytics platform designed to empower organizations to make faster, more informed decisions. It combines governed self-service analytics capabilities with artificial intelligence-powered features to enable employees to easily access, explore, and act on governed data.Key capabilities of Pyramid Analytics include:Unified governed self-service analytics...