JReport is a business intelligence and reporting software that allows users to create interactive reports and dashboards from various data sources. It has a drag-and-drop interface for building reports without coding.
Create interactive reports and dashboards with JReport, a business intelligence software allowing users to connect from various data sources using its drag-and-drop interface.
What is JReport?
JReport is a business intelligence and reporting tool used to create interactive reports and dashboards from multiple data sources. It has an easy-to-use drag-and-drop interface that allows non-technical users to quickly build reports and visualize data without coding.
Some key features of JReport include:
Connecting to various databases, cloud apps, big data sources to access business data
Interactive and visually appealing dashboards with charts, tables, maps etc.
Ad hoc reporting capabilities for self-service BI
Options for scheduling and distributing reports
Collaborative features for sharing reports and annotations
Pixel perfect reporting with control over report formatting
Support for large data volumes and in-memory analytics
APIs and SDKs for customization and embedding reports
JReport can be deployed either cloud-based or on-premise. It's typically used by BI and IT teams in organizations to democratize data access and business insights for fact-based decision making. The self-service aspects make it easy even for non-technical business users to create their own reports without dependency on IT teams.
JReport Features
Features
Drag-and-drop report building
Connects to various data sources
Interactive dashboards and visualizations
Scheduling and distribution of reports
Customizable templates and themes
Mobile-friendly reports
Collaboration and sharing features
Pricing
Subscription-Based
Pros
Intuitive and user-friendly interface
Wide range of data connectivity options
Comprehensive reporting and dashboard capabilities
Tableau is a leading business intelligence and data visualization platform used by organizations of all sizes to transform their data into easy-to-understand visualizations and dashboards. With Tableau, users can connect to a wide range of data sources, prepare and clean the data for analysis, and create interactive data visualizations such...
Sisense is a business intelligence and data analytics software platform designed to help non-technical users prepare, analyze and visualize complex data. Some key features of Sisense include:Intuitive drag-and-drop interface for building interactive dashboards and visualizations like charts, graphs and pivot tables without coding.Ability to connect to wide variety of data...
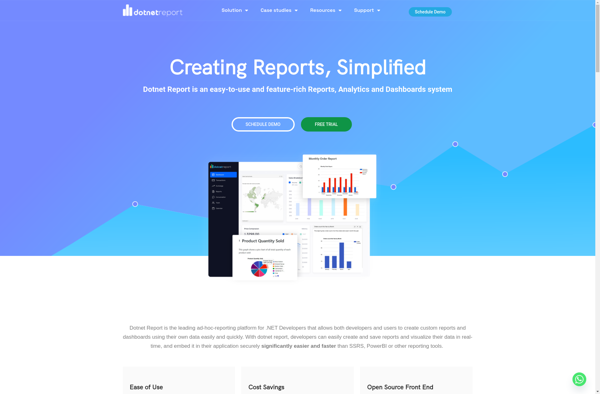
dotnet Report Builder is an open-source reporting tool designed specifically for .NET applications. It allows .NET developers to create rich, customizable reports for both web and desktop applications with minimal coding.Some key features of dotnet Report Builder include:Supports connecting to various data sources like SQL Server, Oracle, MongoDB, REST APIs,...
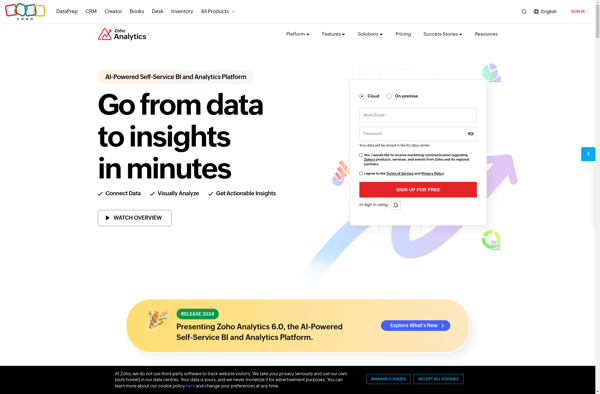
Zoho Analytics is a powerful yet user-friendly business intelligence and data analytics platform used by organizations of all sizes. It allows you to connect data from multiple sources including databases, cloud apps, and files, enabling a unified view of business data.With an intuitive drag-and-drop interface, Zoho Analytics makes it easy...
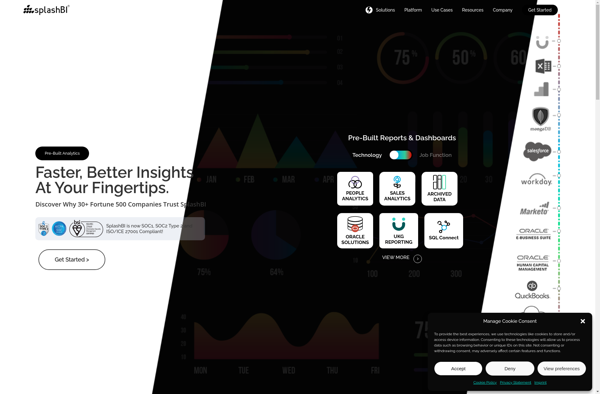
SplashBI is a cloud-based business intelligence and data visualization platform designed for small and medium businesses. Some key features of SplashBI include:Intuitive drag-and-drop interface for building interactive dashboards, charts, tables and reportsLibrary of customizable widgets and visualizations including bar, line and pie chartsAutomated report scheduling and distributionReal-time data connectivity to...
Roambi is a business intelligence and data visualization platform designed to help companies gain insights from their data. It enables users to consolidate data from multiple sources, analyze it visually, and create interactive dashboards and reports that can be accessed on mobile devices.Some key features of Roambi include:Data connectivity -...
bipp Analytics is a business intelligence and data visualization software that empowers users to connect their data, analyze it visually, and extract meaningful insights. Some key features of bipp Analytics include:Data Connectors - Connect your data from databases, cloud apps, Excel, etc. with pre-built connectors.Interactive Dashboards - Build visually appealing,...
Pyramid Analytics is an advanced business intelligence and analytics platform designed to empower organizations to make faster, more informed decisions. It combines governed self-service analytics capabilities with artificial intelligence-powered features to enable employees to easily access, explore, and act on governed data.Key capabilities of Pyramid Analytics include:Unified governed self-service analytics...