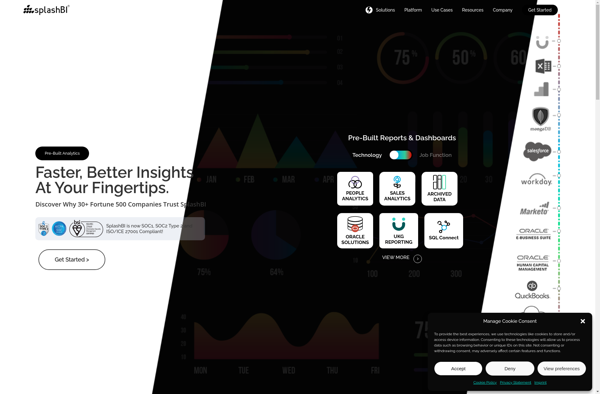
SplashBI is a cloud-based business intelligence and data visualization platform aimed at small and medium businesses. It provides an easy-to-use interface for building interactive dashboards, charts, reports and KPI metrics.
SplashBI: Cloud BI Solution for Small & Medium Businesses
Build interactive dashboards, charts, reports, and KPI metrics with SplashBI's user-friendly interface and cloud-based platform.
What is SplashBI?
SplashBI is a cloud-based business intelligence and data visualization platform designed for small and medium businesses. Some key features of SplashBI include:
Intuitive drag-and-drop interface for building interactive dashboards, charts, tables and reports
Library of customizable widgets and visualizations including bar, line and pie charts
Automated report scheduling and distribution
Real-time data connectivity to cloud apps like Google Sheets, MySQL, PostgreSQL and more
Role-based permissions and sharing capabilities
Mobile optimization for accessing analytics on-the-go
SplashBI aims to make business intelligence and data analytics accessible for small teams and companies. Its easy-to-use workflow allows no-code creation of impactful, shareable dashboards. With its cloud infrastructure and affordability, SplashBI is well-suited for small business looking to gain more data-driven insights without dedicating extensive resources towards a platform.
SplashBI Features
Features
Cloud-based business intelligence and data visualization platform
Easy-to-use interface for building interactive dashboards, charts, reports, and KPI metrics
Connects to various data sources, including databases, spreadsheets, and cloud-based applications
Drag-and-drop functionality for creating visualizations
Customizable dashboards and reports
Collaboration and sharing features
Mobile-friendly design
Pricing
Subscription-Based
Pros
Intuitive user interface for non-technical users
Affordable pricing options for small and medium businesses
Wide range of data connectors and visualization options
Collaborative features for team-based reporting
Mobile accessibility for on-the-go analysis
Cons
Limited customization options compared to enterprise-level BI tools
Potential performance issues with large data sets
Limited advanced analytical capabilities compared to more robust BI platforms
Microsoft Power BI is a powerful business analytics service developed by Microsoft. It empowers users to transform raw data into meaningful insights, create interactive reports and dashboards, and share data-driven stories within an organization. Power BI is designed to help businesses and individuals make informed decisions based on a comprehensive...
Tableau is a leading business intelligence and data visualization platform used by organizations of all sizes to transform their data into easy-to-understand visualizations and dashboards. With Tableau, users can connect to a wide range of data sources, prepare and clean the data for analysis, and create interactive data visualizations such...
JasperReports is an open source Java reporting library that can generate various types of reports from different data sources. It is very flexible and offers many features:Supports connecting to various data sources like SQL databases, NoSQL databases, XML, JSON, CSV files, etc.Can generate reports in multiple formats including PDF, HTML,...
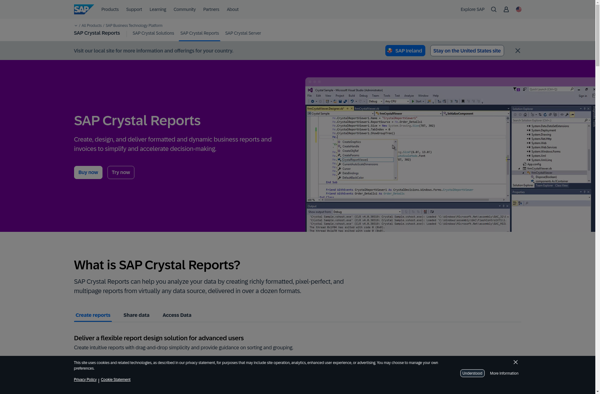
Crystal Reports is a flexible business reporting tool used to design and generate professional reports from virtually any data source. Originally created by Crystal Services and now owned by SAP, Crystal Reports has been around since the early 1990s and has become one of the most popular reporting tools used...
SQL Server Reporting Services (SSRS) is a comprehensive enterprise reporting platform from Microsoft that allows users to create and deliver interactive, mobile-ready reports across the organization. SSRS can connect to almost any data source to build rich, interactive reports with charts, maps, sparklines and more.Key features and capabilities of SSRS...
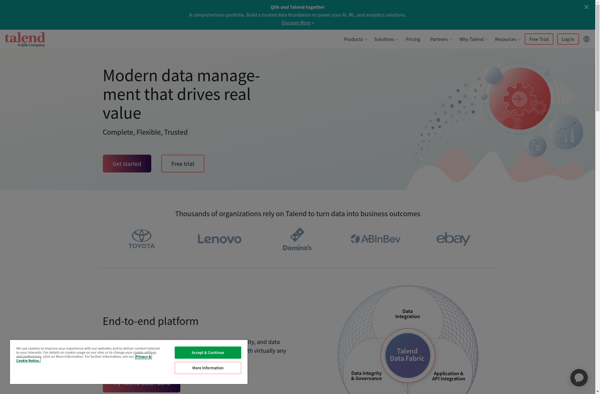
Talend is an open source data integration and management platform designed to help organizations effectively collect, transform, cleanse and share data across systems and teams. Some key capabilities and benefits of Talend include:Graphical drag-and-drop interface to build data integration jobs and workflows without codingOver 900 pre-built data connectors to leading...
Looker Studio is a business intelligence and analytics platform designed to help companies analyze data and gain valuable insights. It provides an intuitive, web-based interface that enables users without technical skills to explore, visualize and share data easily.Some key capabilities and benefits of Looker Studio include:Interactive dashboards - Users can...
Pentaho is a comprehensive open source business intelligence (BI) suite that provides a range of data integration, analytics, visualization, reporting, data mining, and workflow capabilities. It is designed to help businesses consolidate data from disparate sources for unified analytics and reporting.Some of the key capabilities and components of Pentaho include:Data...
Redash is an open-source business intelligence and data visualization web application. It allows users to connect to multiple data sources including SQL databases, query and visualize the data, and create interactive dashboards to share insights.Some key features of Redash:Connect to data sources like PostgreSQL, MySQL, SQL Server, Redshift, BigQuery and...
Amazon QuickSight is a fast, cloud-powered business intelligence service that makes it easy to build visualizations, perform ad-hoc analysis, and quickly get business insights from your data. Some key features include:Intuitive visual interface that makes it easy to visualize and explore dataBroad data connectivity to connect to data sources like...
Marple is an open-source, Markdown-based slide deck tool for creating presentations. It provides a minimalistic editor interface to write slide content in Markdown format, which then gets rendered into an elegant slide deck for presenting.Some key features of Marple:Write slide content in easy-to-read and write Markdown format. Format headings, lists,...
RAWGraphs is a free, open-source web tool created for anyone to easily visualize and share data using the most common graphical formats. The simple drag and drop interface makes it easy for non-experts to quickly generate a wide variety of charts and diagrams that can be exported and shared as...
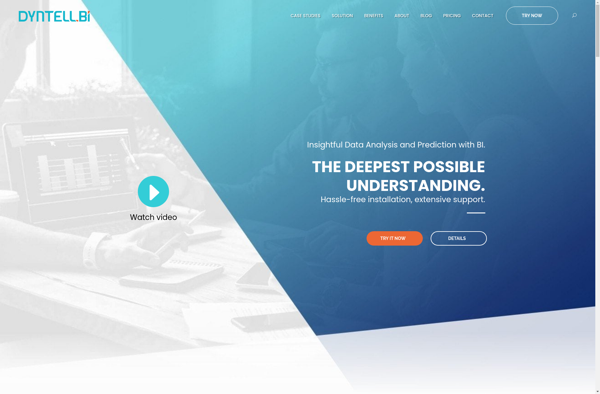
Dyntell Bi is a self-service business intelligence and data visualization software designed to help companies make data-driven decisions. It allows users to connect to a wide range of data sources including SQL databases, cloud apps, and Excel files to import data.Once the data is imported, Dyntell Bi provides an intuitive...
Xplenty is a cloud-based ETL (extract, transform, load) and data integration platform designed to help users effectively prepare and analyze data from diverse sources. Some key features of Xplenty include:Intuitive drag-and-drop interface for building automated data pipelines without codingPre-built integrations with 100+ data sources and destinations like databases, data warehouses,...
Zylotech is an emerging no-code AI platform designed to make AI accessible to everyone regardless of technical skillset. The platform provides an intuitive visual interface using building blocks to develop AI models without writing any code.Some key capabilities of Zylotech include:Drag-and-drop interface to build end-to-end AI workflows from data ingestion...
Keboola Connection is a cloud-based data integration and transformation platform designed to help businesses efficiently manage their data pipelines and gain actionable insights. Some key features of Keboola Connection include:Drag-and-drop interface to visually build data workflows and ETL processes without codingPre-built connectors to easily integrate data from various sources like...
JReport is a business intelligence and reporting tool used to create interactive reports and dashboards from multiple data sources. It has an easy-to-use drag-and-drop interface that allows non-technical users to quickly build reports and visualize data without coding.Some key features of JReport include:Connecting to various databases, cloud apps, big data...