Dyntell Bi icon

Dyntell Bi

Dyntell Bi is a business intelligence and data visualization software that allows users to connect to various data sources, create interactive dashboards and reports, and share insights. It provides drag-and-drop functionality to build charts, graphs, and other visuals.

What is Dyntell Bi?

Dyntell Bi is a self-service business intelligence and data visualization software designed to help companies make data-driven decisions. It allows users to connect to a wide range of data sources including SQL databases, cloud apps, and Excel files to import data.

Once the data is imported, Dyntell Bi provides an intuitive drag-and-drop interface to build interactive dashboards, reports, and visualizations without coding. It has a library of customizable charts such as bar, line, pie, scatter plots, heat maps, treemaps, and more. The visuals auto-update when the underlying data changes so insights are always current.

Key features include data modeling for shaping and combining datasets, robust calculation and transformation tools for deriving metrics, advanced filtering for slicing data on multiple parameters, and interactive drill-down to view granular details. Dashboards and reports can be shared with other users and scheduled for periodic distribution.

Dyntell Bi has easy-to-use data modeling features that allow analysts to shape and combine data coming from multiple sources for unified analysis. It provides a calculation editor to create custom metrics as well as tools to append, merge, group, pivot, and reshape datasets.

The software supports collaboration by allowing multiple users to access published dashboards and reports. Users can add annotations and comments directly on the visuals to discuss insights. Access and permission controls allow admins to restrict data access as per business needs.

Overall, Dyntell Bi is an intuitive BI and visualization platform designed for self-service analytics across organizations. With its drag-and-drop interface, customizable visualizations, and collaboration capabilities, it empowers users to easily analyze data and share impactful insights.

The Best Dyntell Bi Alternatives

Top Apps like Dyntell Bi

Microsoft Excel, Microsoft Power BI, Tableau, QlikView, SAP BusinessObjects, Sisense, AnswerMiner, Marple, SplashBI are some alternatives to Dyntell Bi.

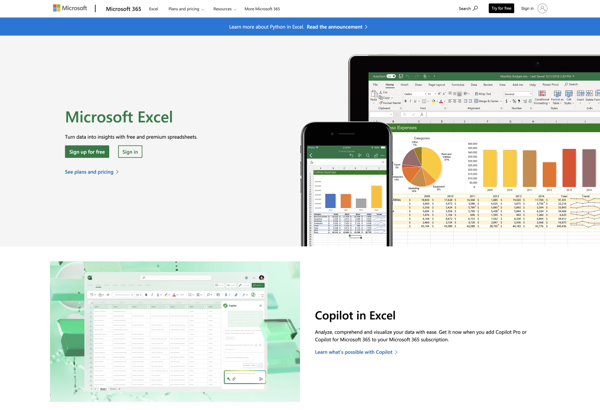
Microsoft Excel

Microsoft Excel stands as the quintessential spreadsheet software, offering unparalleled versatility and functionality for individuals and businesses alike. A cornerstone of the Microsoft Office suite, Excel empowers users to organize, analyze, and interpret data efficiently. Its grid of cells allows for the creation of complex calculations, making it an indispensable...

Microsoft Power BI

Microsoft Power BI is a powerful business analytics service developed by Microsoft. It empowers users to transform raw data into meaningful insights, create interactive reports and dashboards, and share data-driven stories within an organization. Power BI is designed to help businesses and individuals make informed decisions based on a comprehensive...

Tableau

Tableau is a leading business intelligence and data visualization platform used by organizations of all sizes to transform their data into easy-to-understand visualizations and dashboards. With Tableau, users can connect to a wide range of data sources, prepare and clean the data for analysis, and create interactive data visualizations such...

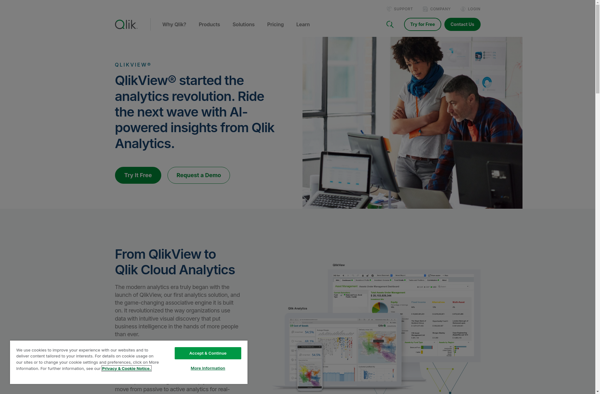
QlikView

QlikView is a business intelligence and data visualization platform used to create interactive dashboards and analytics applications. It was first released in 1993 by the Swedish company Qlik. Key features of QlikView include:Associative data modeling and in-memory analytics engine - Allows fast analysis of large, disparate datasets without predefined schema...

SAP BusinessObjects

SAP BusinessObjects is a comprehensive business intelligence and analytics software suite from SAP. It brings together capabilities for reporting, analysis, dashboards, data visualization, data discovery, and more to help organizations unlock value from their data.Key capabilities and components of SAP BusinessObjects include:Centralized semantic layer for consistent data across...

Sisense

Sisense is a business intelligence and data analytics software platform designed to help non-technical users prepare, analyze and visualize complex data. Some key features of Sisense include:Intuitive drag-and-drop interface for building interactive dashboards and visualizations like charts, graphs and pivot tables without coding.Ability to connect to wide variety...

AnswerMiner

AnswerMiner is an artificial intelligence-powered software that helps companies improve their customer support operations and experiences. It analyzes large volumes of customer service conversation data, including emails, chat transcripts, and call center notes, to provide actionable insights.The key features and benefits of AnswerMiner include:Understanding Frequent Customer Questions and...

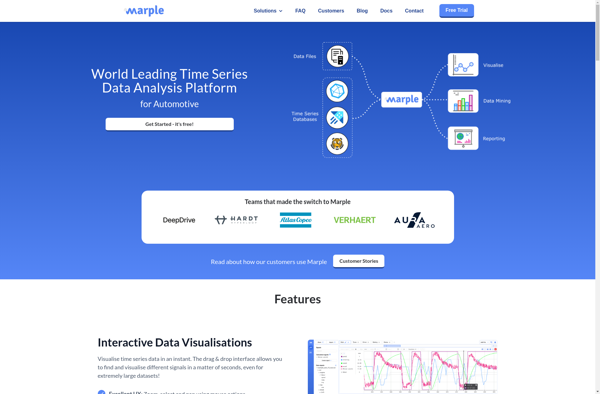
Marple

Marple is an open-source, Markdown-based slide deck tool for creating presentations. It provides a minimalistic editor interface to write slide content in Markdown format, which then gets rendered into an elegant slide deck for presenting.Some key features of Marple:Write slide content in easy-to-read and write Markdown format. Format...

SplashBI

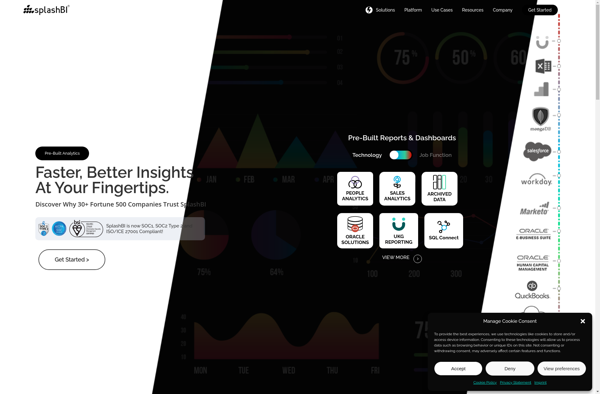
SplashBI is a cloud-based business intelligence and data visualization platform designed for small and medium businesses. Some key features of SplashBI include:Intuitive drag-and-drop interface for building interactive dashboards, charts, tables and reportsLibrary of customizable widgets and visualizations including bar, line and pie chartsAutomated report scheduling and distributionReal-time data connectivity...