AnswerMiner is an AI-powered software that helps companies analyze their customer support conversations, identify frequent questions and pain points, and generate automated answers to those questions. It uses natural language processing to understand unstructured customer convers
Discover how AnswerMiner helps businesses analyze customer support conversations, identify frequent questions and pain points, and generate automated answers with natural language processing technology.
What is AnswerMiner?
AnswerMiner is an artificial intelligence-powered software that helps companies improve their customer support operations and experiences. It analyzes large volumes of customer service conversation data, including emails, chat transcripts, and call center notes, to provide actionable insights.
The key features and benefits of AnswerMiner include:
Understanding Frequent Customer Questions and Pain Points: Using natural language processing and machine learning algorithms, AnswerMiner can automatically identify the most common questions, complaints, requests, and issues that come up in customer conversations. This allows support teams to proactively address frequent problems.
Generating Automated Answers: For common customer questions and issues, AnswerMiner can automatically generate answers tailored to that specific company's products, services, policies etc. This saves support agents time and drives consistency.
Measuring Performance and Sentiment: AnswerMiner analyzes conversations to evaluate overall satisfaction levels, agent performance, problem areas driving complaints, resolution times, and more. Teams get an in-depth view of critical support metrics.
Omnichannel Support: AnswerMiner works across various channels including email, live chats, customer service notes, community forums, and more. It brings everything together into a unified dashboard.
Easy Integration and Customization: As a cloud-based SaaS application, AnswerMiner can integrate easily with existing systems like CRMs, ticketing tools, chat tools, etc. It also allows for customization to fit specific customer support environments.
By leveraging AnswerMiner's AI capabilities, customer support and success teams can significantly improve efficiency, consistency, and customer experiences. It's an intelligent automation solution purpose-built for customer service in the modern age.
AnswerMiner Features
Features
Natural language processing to analyze customer support conversations
Identification of frequent questions and pain points
Automated generation of answers to common questions
Customizable knowledge base and response templates
Integration with popular customer service platforms
Pricing
Subscription-Based
Pros
Saves time and resources by automating response generation
Improves customer satisfaction by providing quick and accurate answers
Provides valuable insights into customer needs and pain points
Scalable solution for growing customer support teams
Cons
Requires investment in data labeling and model training
Potential for inaccurate or inappropriate responses if not properly configured
Ongoing maintenance and updates required to keep knowledge base current
Microsoft Excel stands as the quintessential spreadsheet software, offering unparalleled versatility and functionality for individuals and businesses alike. A cornerstone of the Microsoft Office suite, Excel empowers users to organize, analyze, and interpret data efficiently. Its grid of cells allows for the creation of complex calculations, making it an indispensable...
Microsoft Power BI is a powerful business analytics service developed by Microsoft. It empowers users to transform raw data into meaningful insights, create interactive reports and dashboards, and share data-driven stories within an organization. Power BI is designed to help businesses and individuals make informed decisions based on a comprehensive...
Tableau is a leading business intelligence and data visualization platform used by organizations of all sizes to transform their data into easy-to-understand visualizations and dashboards. With Tableau, users can connect to a wide range of data sources, prepare and clean the data for analysis, and create interactive data visualizations such...
Metabase is an open source business intelligence platform and analytics tool. It allows anyone on a team to ask questions about their data, explore it, and share insights with others through easy-to-create dashboards, charts, and visualizations. Metabase provides an intuitive frontend interface so users can get answers and discover trends...
Looker Studio is a business intelligence and analytics platform designed to help companies analyze data and gain valuable insights. It provides an intuitive, web-based interface that enables users without technical skills to explore, visualize and share data easily.Some key capabilities and benefits of Looker Studio include:Interactive dashboards - Users can...
Gephi is an open-source, cross-platform network analysis and visualization software package developed in Java. It allows users to visualize, interactively explore, spatially arrange, manipulate, and statistically analyze network graphs made up of nodes and edges. Gephi provides easy and broad access to complex network data in order to help applied...
Google Charts is a robust and flexible JavaScript charting and data visualization library provided for free by Google. It offers developers a highly customizable way to create interactive charts, graphs, and data tables that seamlessly integrate into web pages and applications.With Google Charts, you can visualize complex data sets and...
Apache Superset, formerly known as Caravel, is an open-source business intelligence (BI) web application. It was created by Maxime Beauchemin at Airbnb.Superset allows you to explore and visualize data, create interactive dashboards, and share insights across your organization. It integrates with common database technologies like MySQL, Postgres, SQL Server, and...
Plotly is an open-source graphing library that allows users to create interactive, publication-quality graphs, charts, and dashboards. It supports Python, R, JavaScript, and Excel as programming languages. Some key features of Plotly include:Interactive visualization - Plotly charts are interactive with features like hover text, zooming, panning, selectable legends, and editable...
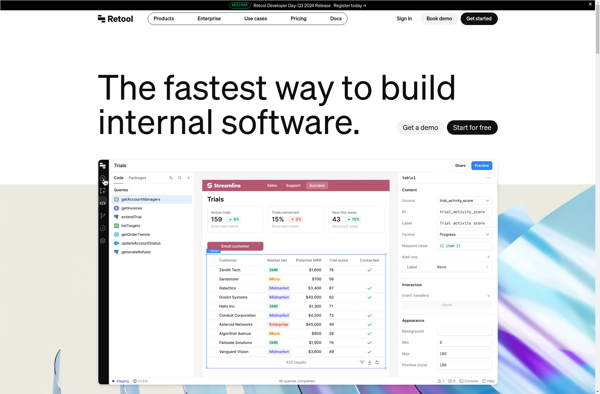
Retool is a low-code development platform designed to help teams build internal tools and business applications faster. It provides an easy-to-use drag and drop interface that allows you to quickly build workflows, forms, charts, kanban boards and more without needing to write any code.Some key features of Retool include:Connects to...
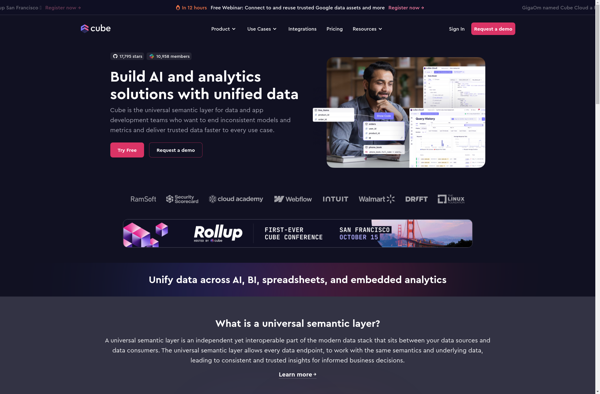
Cube.js is an open-source analytics framework for building cloud-native business intelligence dashboards and applications. It provides a flexible way to analyze and visualize data by generating a data model on top of data warehouses or databases.Some key capabilities and benefits of Cube.js include:Auto-generating a data schema to power analystics dashboards...
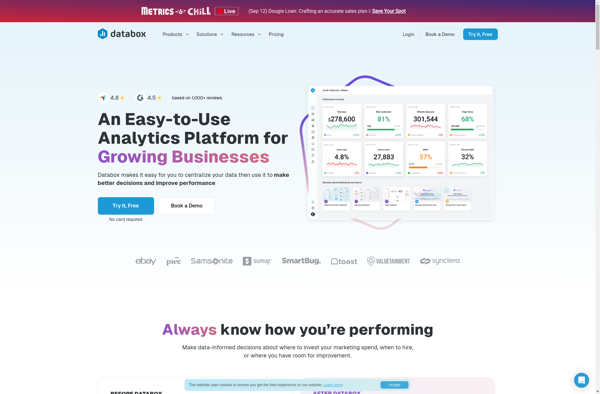
Databox is an open-source personal data platform that enables individuals to manage their personal data securely and privately. Developed by researchers at Imperial College London and the University of Cambridge, Databox allows users to connect data sources like smartphones, wearables, and web apps to feed data into the platform.Once data...
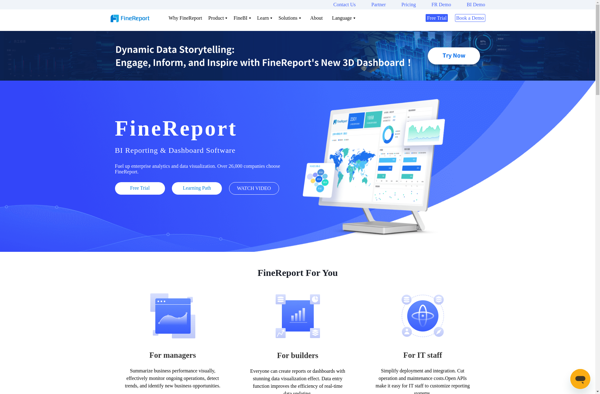
FineReport is a business intelligence and reporting solution developed by FineReport Software Co., Ltd. It provides an intuitive drag-and-drop interface for report design, allowing users to easily create interactive and visually engaging reports, dashboards, and data visualizations.Some key features of FineReport include:Connectivity to a wide range of data sources like...
Knowage is an open-source business intelligence and data analytics platform. It provides a wide range of features for extracting insights from data, including:Interactive dashboards and reports for data visualizationAd-hoc reporting and analysisAdvanced data visualization with charts, graphs, and mapsData mining and OLAP analysisScorecards and KPI managementData integration from multiple sourcesResponsive...
GGobi is an open-source, multi-platform software application for interactive exploratory data analysis. It allows users to visualize high-dimensional datasets by leveraging interactive graphics such as scatterplots, parallel coordinates, star glyphs, time series plots, tours (animation sequences for exploring n-dimensional data spaces), as well as dimension reduction techniques like principal components...
Vega Voyager is an open-source data visualization tool developed by the University of Washington Interactive Data Lab. It provides a user-friendly graphical interface for rapidly creating custom interactive visualizations from tabular dataset inputs without writing any code.With Vega Voyager, users can simply drag-and-drop their dataset and select desired visualization types...
Cirkulate is an open-source, self-hosted alternative to Google Analytics that allows web developers and site owners to track traffic and analyze usage statistics without compromising visitor privacy. Some key features of Cirkulate include:Lightweight and easy to install. Cirkulate uses a SQLite database and PHP scripts, making it simple to set...
DigDash Enterprise is a feature-rich business intelligence and analytics platform tailored for large enterprises. It enables organizations to aggregate data from multiple sources, gain actionable insights, and make data-driven decisions.Key capabilities include:Data connectivity - Connect to 100+ data sources such as databases, cloud apps, big data platforms, etc. Integrates nicely...
Dotmatics Vortex is a scientific informatics software platform used by pharmaceutical, biotechnology, and other research organizations to efficiently capture, store, analyze, and share chemical and biological data.Key features of Dotmatics Vortex include:Chemical registration system to store and search compounds and associated dataBio registration system to store and search biological entities...
RAWGraphs is a free, open-source web tool created for anyone to easily visualize and share data using the most common graphical formats. The simple drag and drop interface makes it easy for non-experts to quickly generate a wide variety of charts and diagrams that can be exported and shared as...
Gaio is an open-source monitoring and observability platform optimized for cloud-native infrastructure and applications. It provides comprehensive visibility into systems, services, and applications deployed in public, private, or hybrid cloud environments.Some key capabilities and benefits of Gaio include:Metrics - Ingest, process, store and visualize metrics from hosts, containers, services, and...
AVORA is a free, open-source video conferencing software designed for online meetings, webinars, remote teaching and other collaborative tasks. It provides high-quality audio and video communication in a customizable virtual meeting space.Some key features of AVORA include:Real-time HD video and crystal clear audio for natural conversationsScreen sharing to present slides,...
Dyntell Bi is a self-service business intelligence and data visualization software designed to help companies make data-driven decisions. It allows users to connect to a wide range of data sources including SQL databases, cloud apps, and Excel files to import data.Once the data is imported, Dyntell Bi provides an intuitive...
ClearStory Data is a big data analytics software platform designed to help organizations access, analyze, and collaborate around their rapidly growing volumes and varieties of enterprise data. Some key capabilities include:- Data Harmonization - Ingest, combine, and prepare multiple disparate data sources including structured, multi-structured, and unstructured data.- Fast Data...
Quadrigram is an open-source grammar, spelling, and style checking software. It was created as an alternative to commercial options like Grammarly or Microsoft Editor. Quadrigram analyzes written text and uses natural language processing and machine learning algorithms to detect grammar, spelling, punctuation, and other stylistic issues.Key features of Quadrigram include:Grammar...
CrunchMetrics is a business intelligence and data analytics software platform aimed at helping companies make data-driven decisions. It allows users to connect to various data sources, clean and transform data, and create interactive dashboards and reports to gain insights.Key features of CrunchMetrics include:Drag-and-drop interface to build dashboards with charts, tables,...
Planchette Online is a free web-based Ouija board experience that allows users to have a simulated séance without needing to purchase a physical Ouija board. Users simply visit the Planchette Online website and are greeted with a realistic 3D rendering of a classic Ouija board on a wooden table.To start...
Sympathy for Data is an open-source data visualization and analytics platform used by data scientists, analysts, and business users to understand trends and patterns in complex data sets. It was created by a team at Urika, LLC as an alternative to proprietary business intelligence tools.Key features of Sympathy for Data...
Astera ReportMiner is a self-service data preparation and reporting solution designed for business users and analysts. It provides an intuitive graphical interface to easily combine and transform data from multiple sources like databases, cloud apps, Excel, JSON and CSV files.Key capabilities and benefits include:Intuitive drag-and-drop interface to blend, clean, transform...