Gephi
Gephi: Network Analysis and Visualization Softwares
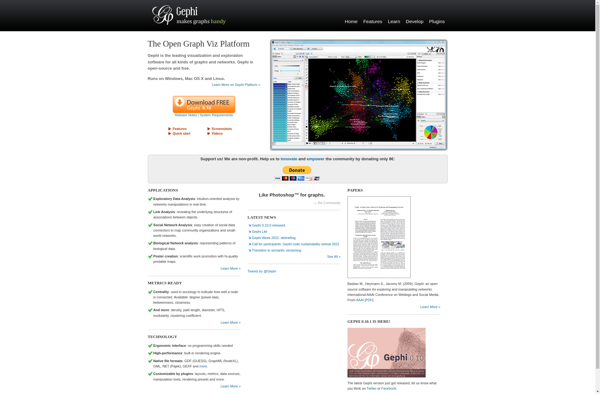
Gephi is an open-source network analysis and visualization software package. It allows users to interactively visualize and explore network graphs, run statistical analysis on the structure and content of the networks, and generate high-quality graphical renderings for publications.
What is Gephi?
Gephi is an open-source, cross-platform network analysis and visualization software package developed in Java. It allows users to visualize, interactively explore, spatially arrange, manipulate, and statistically analyze network graphs made up of nodes and edges. Gephi provides easy and broad access to complex network data in order to help applied researchers and specialists gain a deep understanding of the interconnected systems, relationships, and patterns within their data.
Key features of Gephi include interactive visualization and exploration, being able to filter nodes and edges according to various metrics and statistics calculated for each element, clustering and community detection algorithms, extensive layout algorithms for arranging nodes including force-directed, circular, and geo layouts, statistical analysis modules, the ability to import and export data files in a variety of formats, and generation of high-quality graphical renderings for publications and presentations.
The interactive user interface of Gephi facilitates understanding the structure of network data, running analyses, and filtering down to elements of interest. Statistical analyses like centrality metrics, community detection, and path analysis assist in discovering patterns. Dynamic filtering enables focusing analyses and visualizations on subsets of interest. Varied layout algorithms highlight different aspects of the networks. The high-quality graphics and images Gephi can generate are useful for reporting key insights about the data in publications and presentations.
With its extensive range of features and its open-source and cross-platform nature, Gephi has become a popular network analysis toolbox across IT, business consulting, healthcare, academia, and other fields dealing with relationship data across people, organizations, infrastructure, events, and more.
Gephi Features
Features
- Interactive visualization and exploration of network graphs
- Statistical analysis tools to examine network structure and content
- Algorithms for network clustering, ranking, and layout
- Filtering, manipulation and partitioning of graphs
- Dynamic filtering during visualization
- Generation of high-quality graphical renderings for publication
Pricing
- Open Source
Pros
Cons
Official Links
Reviews & Ratings
Login to ReviewThe Best Gephi Alternatives
View all Gephi alternatives with detailed comparison →
Top Data Visualization and Network Analysis and other similar apps like Gephi
Here are some alternatives to Gephi:
Suggest an alternative ❐Webgraphviz

Tableau

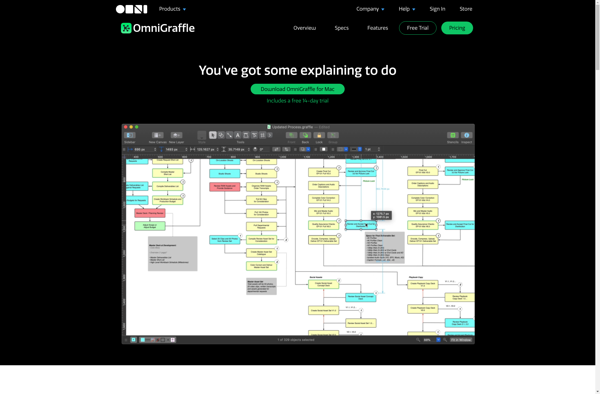
OmniGraffle
PlantUML

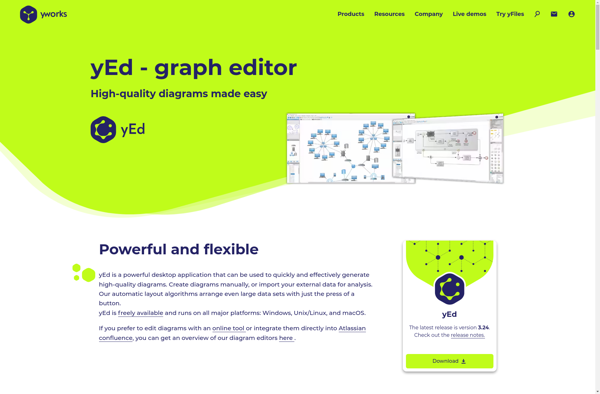
YEd Graph Editor
InfraNodus

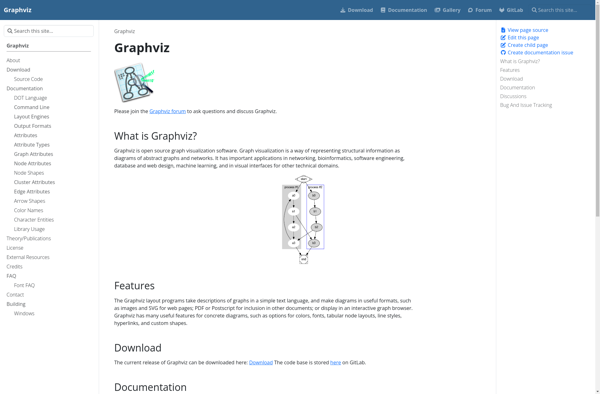
Graphviz
Linkurious

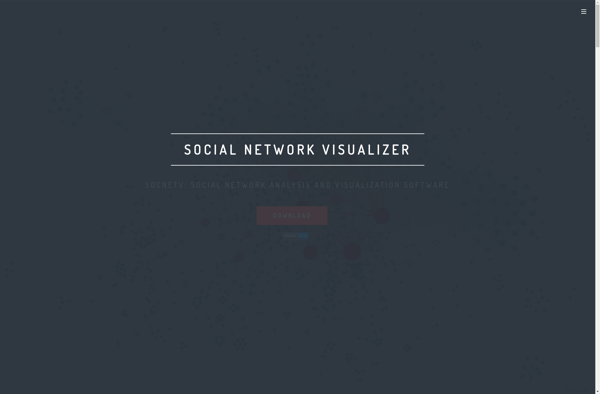
SocNetV
Neoclipse

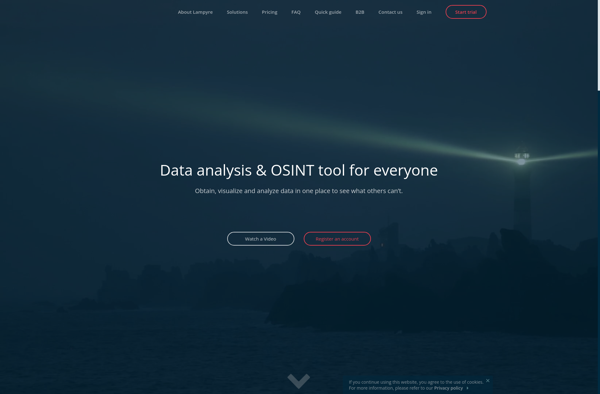
Lampyre
Cytoscape

AnswerMiner

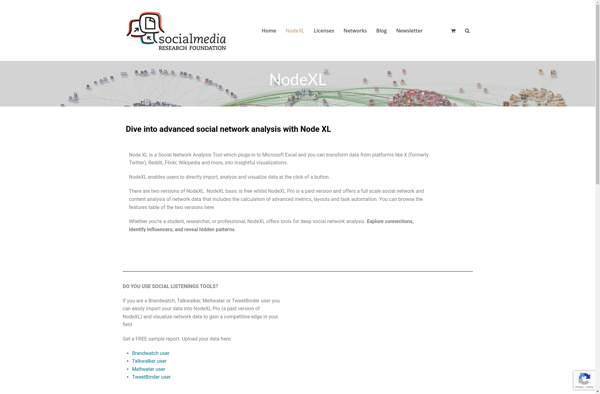
NodeXL
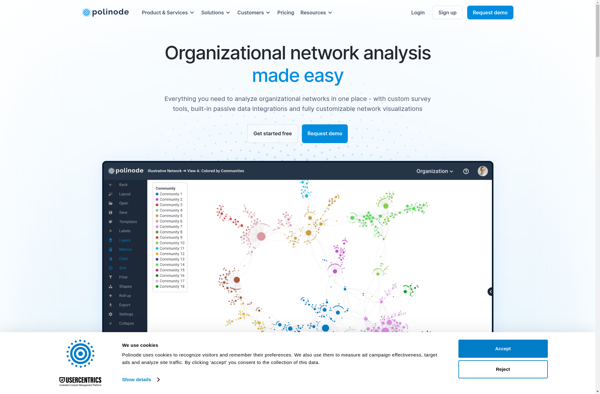
Polinode
Blockdiag

Grapholite

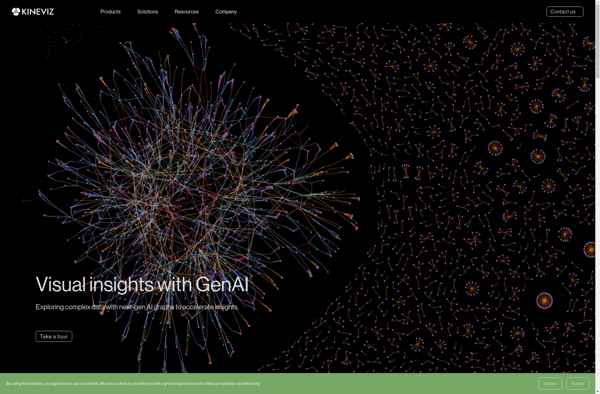
GraphXR
JetPack Data
Neo4j Bloom

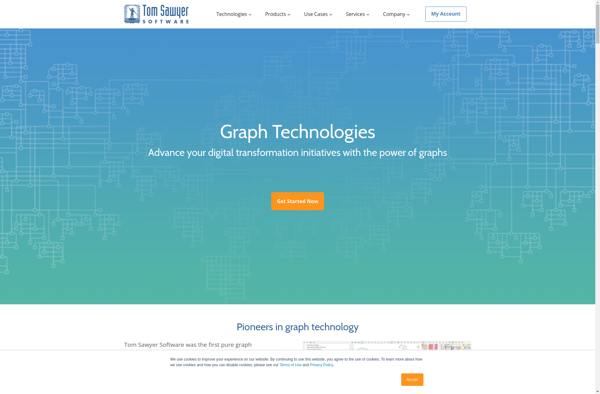
Tom Sawyer Software
Socilyzer

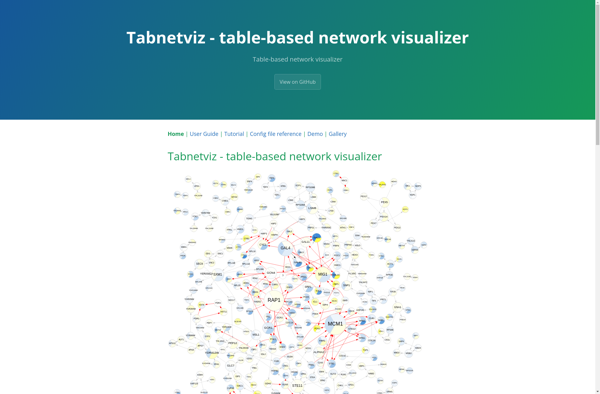
Tabnetviz
Marple

Graphynx
GraphThing

Graphity

TULIP

Theory Maker

YFiles for HTML
Arcade Analytics

Hohli

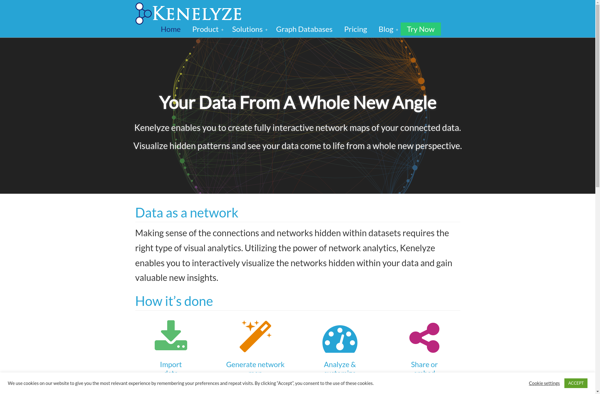
Kenelyze