Linkurious

Linkurious: Graph Visualization and Analysis Software
Linkurious is a graph visualization and analysis software designed specifically for investigating connections in networks. It allows users to uncover hidden links, detect patterns & communities, and visualize complex data relationships.
What is Linkurious?
Linkurious is a software designed specifically for graph visualization and network analysis. It allows users to load their network data, such as connections between people, transactions, or communication records, and visualize these connections in an interactive graphical interface.
Some key features of Linkurious include:
- Powerful graph visualization with automatic layouts that spotlight patterns and communities
- Explorer and search tools to investigate connections by filtering nodes and links
- Integrated analytics to quantify networks with metrics like centrality, clustering, and more
- Collaboration support enabling analysts to work together on the same graph
- Customizable visual elements and dashboards for users' specific needs
- APIs and interfaces available to integrate with other data tools and workflow
Linkurious is beneficial for a wide variety of use cases involving understanding connections in data, including fraud detection, cybersecurity, law enforcement investigations, intelligence analysis, social network analysis, supply chain analysis, and more.
With its unique graph visualization capabilities and analytics, Linkurious simplifies exploring even the largest, most complex networks with millions of nodes and relationships. The software helps analysts discover insights faster, detect risks and patterns, and share findings easily across their organization.
Linkurious Features
Features
- Graph visualization
- Network analysis
- Pattern detection
- Community detection
- Relationship exploration
Pricing
- Subscription-Based
- Pay-As-You-Go
- Open Source
Pros
Cons
Official Links
Reviews & Ratings
Login to ReviewThe Best Linkurious Alternatives
View all Linkurious alternatives with detailed comparison →
Top Ai Tools & Services and Network Analysis and other similar apps like Linkurious
Here are some alternatives to Linkurious:
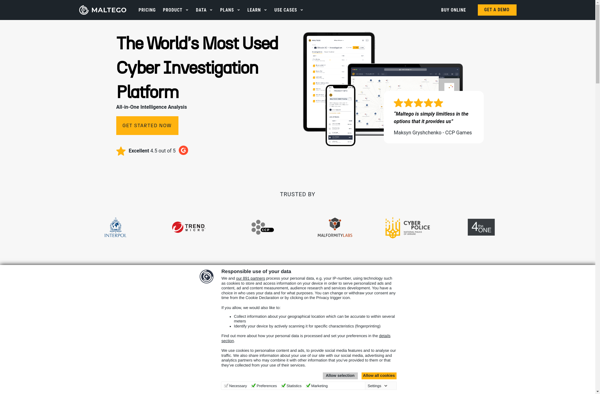
Suggest an alternative ❐Maltego
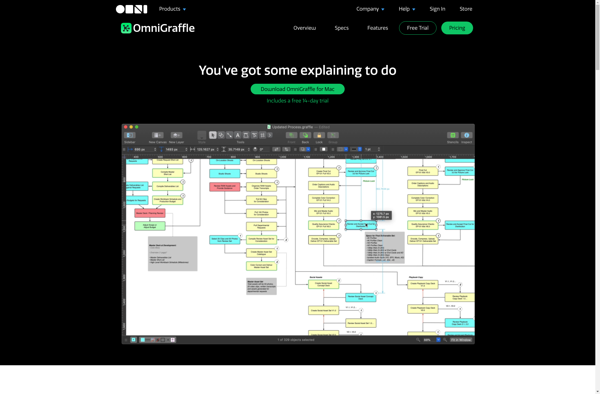
OmniGraffle
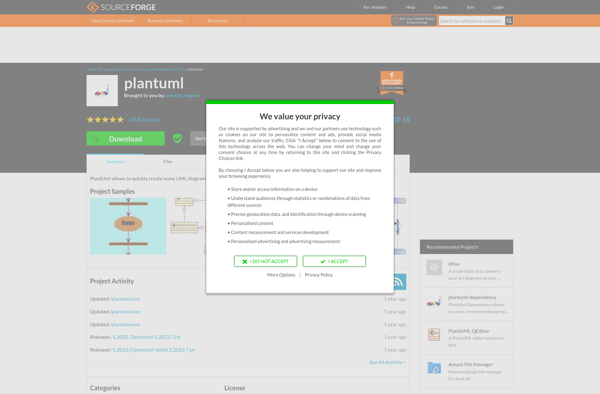
PlantUML
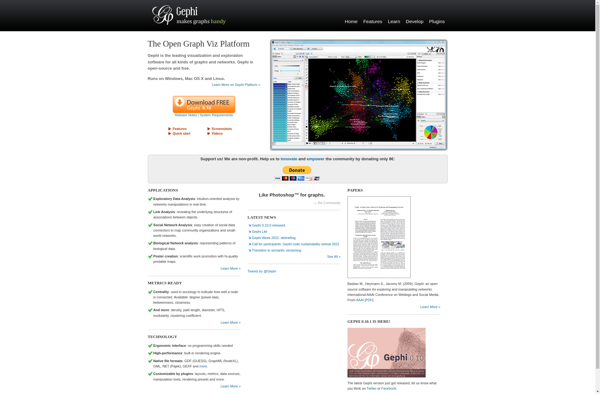
Gephi
YEd Graph Editor
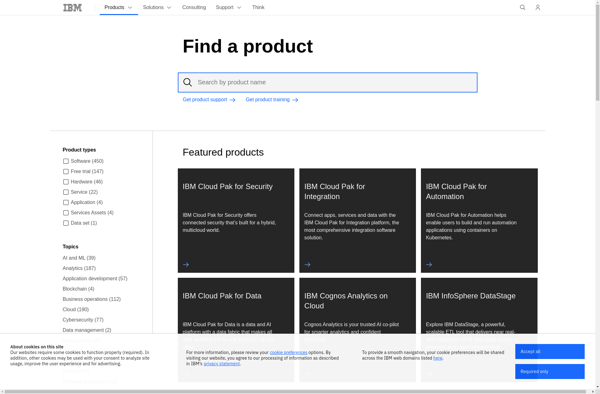
IBM i2 Analyst’s Notebook
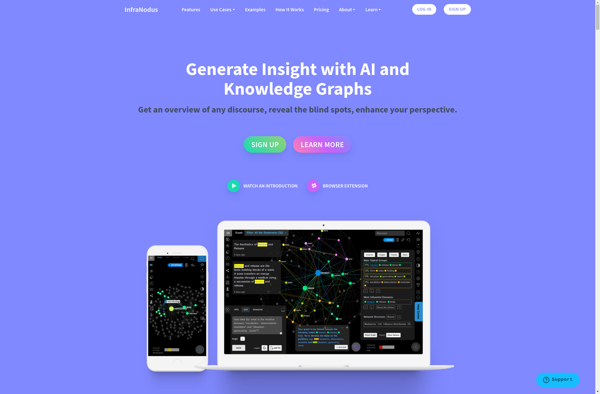
InfraNodus
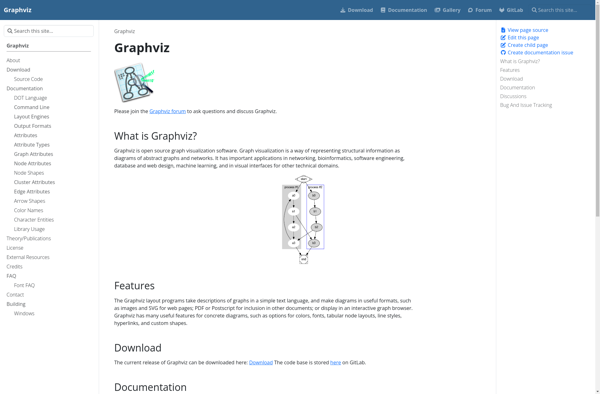
Graphviz
PhoneInfoga
Neoclipse
Cytoscape

ClueMaker
NodeXL
DataWalk
SHIELD AI Technologies

Sentinel Visualizer

Hume
Palantir Gotham
Blockdiag

GraphXR
Crime Tech Solutions Link Analysis

SIREN.io

Neo4j Bloom
Tom Sawyer Software
VizKey

Visallo
Xanalys Link Explorer

Agens Browser
Palantir Metropolis
Arcade Analytics