VizKey is a data visualization and dashboarding software that allows users to connect to data sources, build interactive visualizations and dashboards, and share insights. It has drag-and-drop functionality, template dashboards, and collaboration features.
VizKey: Data Visualization and Dashboarding Software
VizKey allows users to connect to data sources, build interactive visualizations and dashboards, and share insights with drag-and-drop functionality, template dashboards, and collaboration features.
What is VizKey?
VizKey is a business intelligence and data visualization software used by companies to visualize data and build interactive dashboards. It provides an intuitive drag-and-drop interface that allows non-technical users to easily connect to data sources like SQL, Excel, cloud apps, and others to import datasets.
Some key features of VizKey include:
Interactive data visualizations like charts, graphs, gauges, maps, and more
Ability to create and share templated dashboards for better data storytelling
Data modeling capabilities for blending, shaping, and transforming data
Collaboration tools to discuss insights and annotate on dashboards
Scheduled updates and automated report distribution
Access controls and governance for sharing dashboards and apps securely
VizKey is considered easy to use with no coding required. It also connects well to popular business systems without needing APIs. Companies use VizKey to democratize data access, build centralized views of key metrics, monitor business performance, and make data-driven decisions.
VizKey Features
Features
Drag-and-drop interface to build dashboards
Connects to a variety of data sources like SQL, Excel, REST APIs
Library of customizable charts and visualizations
Interactive dashboards with filtering and drilling down
Collaboration tools to share and discuss dashboards
Scheduled report distribution and alerts
Pricing
Freemium
Subscription-Based
Pros
Intuitive and easy to use
Great for non-technical users
Good selection of out-of-the-box visualizations
Scales to large datasets
Affordable pricing
Cons
Limited advanced analytics and calculations
Less flexibility than coding dashboards from scratch
IBM i2 Analyst's Notebook is a powerful visual analysis software used by analysts and investigators to turn complex data into actionable intelligence. It allows users to analyze large volumes of data from multiple sources, identify connections between people, places and events, and visualize these connections in customizable workflows.Key features of...
Linkurious is a software designed specifically for graph visualization and network analysis. It allows users to load their network data, such as connections between people, transactions, or communication records, and visualize these connections in an interactive graphical interface.Some key features of Linkurious include:Powerful graph visualization with automatic layouts that spotlight...
DataWalk is a powerful visual data analytics platform designed to help organizations make sense of complex, interconnected data. It provides an intuitive visual interface that allows users to rapidly analyze large datasets, identify hard-to-spot patterns and connections, and generate meaningful insights.Some key capabilities and benefits of DataWalk include:Visual analysis and...
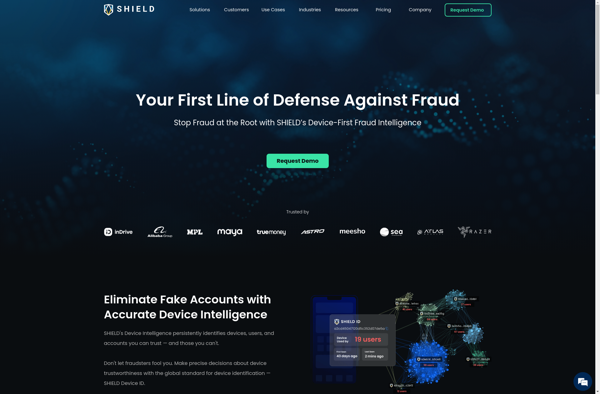
SHIELD AI Technologies is a San Diego, California-based company founded in 2015 that develops artificial intelligence and machine learning systems for defense, national security, and law enforcement applications. The company focuses specifically on computer vision and natural language processing to provide enhanced situational awareness, threat detection, and decision support capabilities.Some...
Sentinel Visualizer is a powerful business intelligence and data visualization software used to create stunning, interactive dashboards and data stories from complex data sets. It provides an easy-to-use drag and drop interface, allowing non-technical users to quickly visualize their data and share actionable insights across the organization.Key features include:Interactive dashboards...
Crime Tech Solutions Link Analysis is an investigative analytics software designed specifically for law enforcement agencies to help them solve more crimes faster. The software allows detectives and crime analysts to upload massive amounts of structured and unstructured data from various sources such as incident reports, witness statements, forensic test...
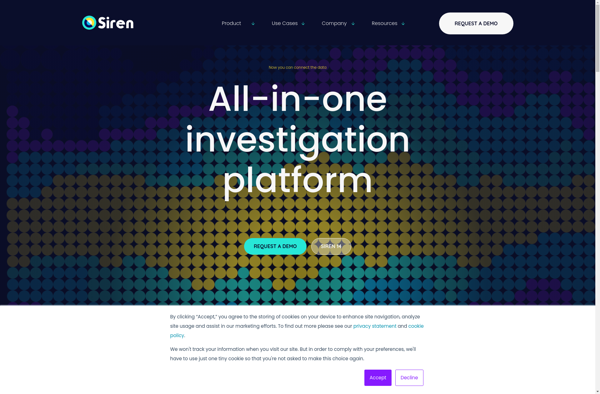
SIREN is an AI-powered cybersecurity software that helps organizations detect external risks by aggregating threat intelligence from across the surface, deep, and dark web. It performs automated searches across millions of data points to identify cyber threats, data leaks, fraud, supply chain issues, competitive intelligence, vulnerabilities, misinformation campaigns, and other...
Visallo is an open source software platform designed for data analysis and visualization, enabling users to visually connect disparate data to uncover relationships and patterns. It supports ingesting structured and unstructured data from multiple sources, integrating them for collaborative investigation.Key features of Visallo include:Upload and integrate varied data types and...
Crime Tech Solutions Sentinel Visualizer is a powerful data visualization and analysis software designed specifically for law enforcement agencies. It ingests and normalizes data from multiple sources, structuralizes it, and allows users to visually explore connections between people, places, events, vehicles, phone numbers, etc.Key features include:Link analysis diagrams to uncover...
Palantir Metropolis is a powerful data management and analytics platform developed by Palantir Technologies. It is designed to help organizations integrate, manage, analyze, and act on massive amounts of disparate data.Some key capabilities of Metropolis include:Data integration - Ingest, standardize, and connect data across siloed sources into a common data...