Palantir Metropolis is a data management and analytics platform used by organizations to integrate, manage, and analyze data. It allows connecting siloed data, building data pipelines, and creating interactive dashboards and applications.
Palantir Metropolis: Data Management and Analytics Platform
Palantir Metropolis is a data management and analytics platform used by organizations to integrate, manage, and analyze data. It allows connecting siloed data, building data pipelines, and creating interactive dashboards and applications.
What is Palantir Metropolis?
Palantir Metropolis is a powerful data management and analytics platform developed by Palantir Technologies. It is designed to help organizations integrate, manage, analyze, and act on massive amounts of disparate data.
Some key capabilities of Metropolis include:
Data integration - Ingest, standardize, and connect data across siloed sources into a common data foundation.
Data pipelines - Build managed data flows to transform and model raw data into accessible, analysis-ready assets.
Interactive analytics - Analyze integrated data through dynamic dashboards, applications, and self-service tools for data scientists and business users.
Security and governance - Enterprise-grade security, access controls, and data governance to meet regulatory requirements.
Scalability - Leverage cluster computing to process petabyte-scale datasets while providing subsecond query responses.
Custom applications - Extend the platform by building custom applications and solutions tailored to business use cases.
Metropolis is particularly geared for sectors like financial services, healthcare, manufacturing, and government/defense that rely on making decisions based on large, complex data.
Tableau is a leading business intelligence and data visualization platform used by organizations of all sizes to transform their data into easy-to-understand visualizations and dashboards. With Tableau, users can connect to a wide range of data sources, prepare and clean the data for analysis, and create interactive data visualizations such...
IBM i2 Analyst's Notebook is a powerful visual analysis software used by analysts and investigators to turn complex data into actionable intelligence. It allows users to analyze large volumes of data from multiple sources, identify connections between people, places and events, and visualize these connections in customizable workflows.Key features of...
Linkurious is a software designed specifically for graph visualization and network analysis. It allows users to load their network data, such as connections between people, transactions, or communication records, and visualize these connections in an interactive graphical interface.Some key features of Linkurious include:Powerful graph visualization with automatic layouts that spotlight...
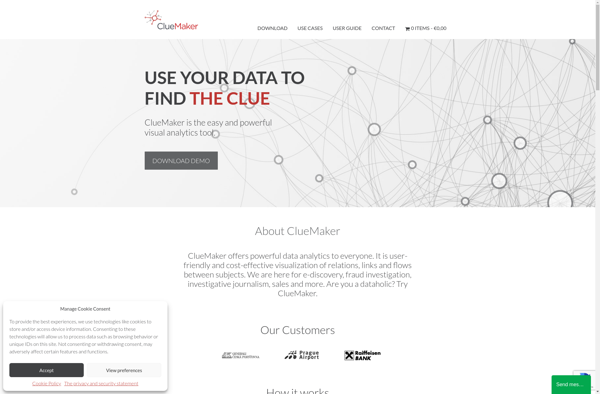
ClueMaker is a visual thinking and learning software designed for K-12 students to create graphic organizers, concept maps, flow charts, timelines, and more to visualize ideas and connections. It provides an engaging way for students to plan essays, understand texts, take notes, brainstorm topics, and bring clarity to their thinking...
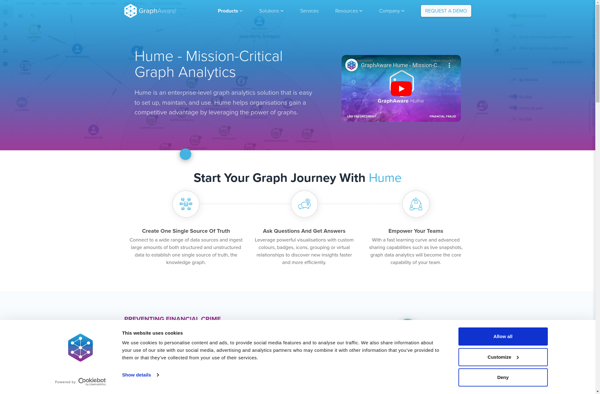
Hume is an open-source virtual assistant designed to help users be more productive. It allows you to have natural language conversations to complete tasks such as scheduling meetings, taking notes, setting reminders, and more.Some key features of Hume include:Natural language processing - Hume understands plain English requests and responds conversationallyCalendar...
SIREN is an AI-powered cybersecurity software that helps organizations detect external risks by aggregating threat intelligence from across the surface, deep, and dark web. It performs automated searches across millions of data points to identify cyber threats, data leaks, fraud, supply chain issues, competitive intelligence, vulnerabilities, misinformation campaigns, and other...
Marple is an open-source, Markdown-based slide deck tool for creating presentations. It provides a minimalistic editor interface to write slide content in Markdown format, which then gets rendered into an elegant slide deck for presenting.Some key features of Marple:Write slide content in easy-to-read and write Markdown format. Format headings, lists,...
VizKey is a business intelligence and data visualization software used by companies to visualize data and build interactive dashboards. It provides an intuitive drag-and-drop interface that allows non-technical users to easily connect to data sources like SQL, Excel, cloud apps, and others to import datasets.Some key features of VizKey include:Interactive...
Orion Magic is a visual automation software designed to help users automate repetitive computer tasks without needing to write any code. It utilizes a graphical, drag-and-drop interface that allows users to visually map out their workflow step-by-step.Some key features and capabilities of Orion Magic include:Web automation for tasks like filling...
bipp Analytics is a business intelligence and data visualization software that empowers users to connect their data, analyze it visually, and extract meaningful insights. Some key features of bipp Analytics include:Data Connectors - Connect your data from databases, cloud apps, Excel, etc. with pre-built connectors.Interactive Dashboards - Build visually appealing,...