Graphviz is an open source graph visualization software used for representing structural information as diagrams of abstract graphs and networks. It provides useful features for creating a variety of graph types like directed graphs, undirected graphs, hierarchies, and more.
Graphviz: Open Source Graph Visualization Software
Graphviz is an open source graph visualization software used for representing structural information as diagrams of abstract graphs and networks. It provides useful features for creating a variety of graph types like directed graphs, undirected graphs, hierarchies, and more.
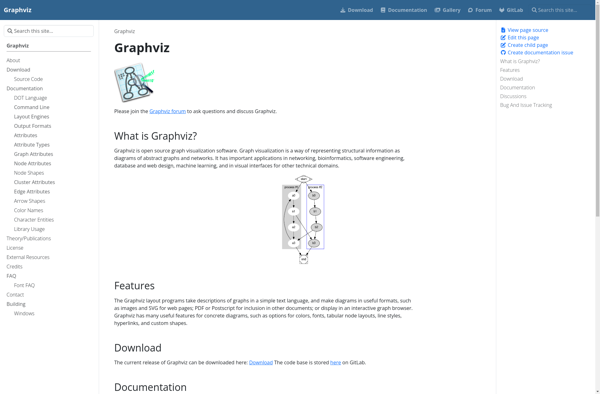
What is Graphviz?
Graphviz is an open-source graph visualization software package developed by AT&T Research. It is used for representing structural information as diagrams of abstract graphs and networks.
Graphviz allows users to create a variety of graph and network types, including directed graphs, undirected graphs, hierarchies, and more. Some of the key features and capabilities include:
Automatic graph layout and drawing - Graphviz uses graph theory methodologies to automatically position nodes and edges in an optimal way.
Support for multiple output formats like PNG, PDF, SVG, etc.
Command line, GUI, and scripting interfaces available.
Advanced customization options for colors, fonts, shapes, styles.
Subgraphs, clusters, and other hierarchical structures.
Graphviz has bindings for many programming languages and platforms. It can be used to visualize graphs from data sources like databases, application code, scripts, and more. Common applications include workflow visualization, UML diagrams, network topology, data flow representations, org charts, and more.
Graphviz is licensed under the Eclipse Public License. It is maintained by the Graphviz project and supported by open-source contributors.
Graphviz Features
Features
Automatic graph layout and visualization
Support for directed graphs, undirected graphs, mixed graphs, subgraphs, clustered graphs and more
Variety of output formats including PNG, PDF, SVG, PostScript
Command line interface and APIs for multiple programming languages
Graph animations
Customizable node and edge shapes, colors, labels, styles
Hierarchical graph layouts
Clustering support
Edge bundling
Interactive graph exploration
Pricing
Open Source
Pros
Open source and free
Powerful automatic graph layout algorithms
Support for large and complex graph datasets
High quality graph visualizations
Extensive customization options
Integration with many programming languages and environments
Cons
Steep learning curve
Cryptic command line interface
Limited interactive features compared to some commercial tools
Difficult to style graphs consistently across outputs
No native support for dynamic or interactive graphs
Webgraphviz is an online interactive graph and diagram creation application. It allows users to visually represent structural information as abstract graphs and networks. Some of the key features and capabilities of Webgraphviz include:Intuitive graphical interface to create various types of diagrams like flowcharts, entity relationship diagrams, UML diagrams, circuit diagrams...
Microsoft Office Visio is diagramming and vector graphics software developed by Microsoft. It is used to create a wide variety of business diagrams and visualizations including flowcharts, organizational charts, network diagrams, workflows, floorplans, and more.Key features of Visio include:Hundreds of professionally-designed templates for quick diagram creationIntuitive drag-and-drop interface to easily...
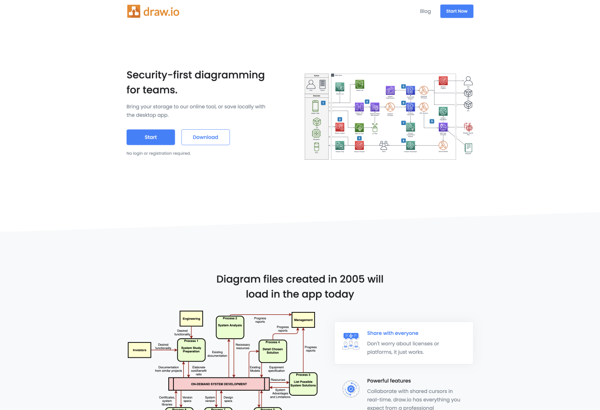
draw.io is a feature-rich diagramming and flowchart software that runs in your web browser. As a freemium tool, draw.io offers a free basic version as well as paid plans with more functionality for professionals and teams.With an intuitive drag-and-drop interface and built-in shape libraries, draw.io makes it easy for anyone...
Mermaid is an open-source visualization tool that allows users to create a variety of charts, diagrams, and visualizations using a simple text-based language. Some of the key benefits and capabilities of Mermaid include:Text-based - No need to use cumbersome GUI diagram editors. Diagrams are defined using a markdown-inspired text language...
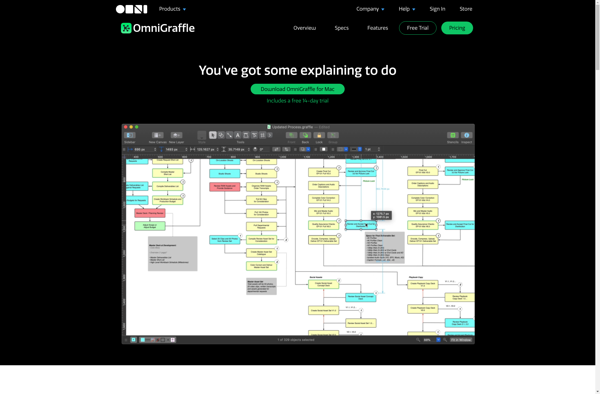
OmniGraffle is a powerful, versatile diagramming application developed by The Omni Group for macOS and iOS. First released in 2001, OmniGraffle enables users to create a wide range of diagrams, charts, illustrations, and graphic documents.With an intuitive and flexible interface, OmniGraffle makes it easy to quickly map out concepts, ideas,...
PlantUML is an open-source tool used for rapidly creating UML diagrams from a plain text language. It supports all standard UML diagrams like use case diagrams, component diagrams, class diagrams, sequence diagrams, state diagrams, activity diagrams, etc. The main goal of PlantUML is to provide a simple and efficient way...
Gephi is an open-source, cross-platform network analysis and visualization software package developed in Java. It allows users to visualize, interactively explore, spatially arrange, manipulate, and statistically analyze network graphs made up of nodes and edges. Gephi provides easy and broad access to complex network data in order to help applied...
Google Drawings is a free online diagramming and charting tool offered by Google as part of its Google Workspace productivity suite. It allows users to create flowcharts, organizational charts, mind maps, concept maps, site maps, and other types of diagrams.Some key features of Google Drawings include:Intuitive drag-and-drop interface for easily...
yEd Graph Editor is a free, powerful desktop application for Windows, macOS and Linux that can be used to quickly and easily create diagrams. It supports a wide range of diagram types including flowcharts, network diagrams, UML diagrams, BPMN diagrams, mind maps, organization charts, and more.Some key features of yEd...
Code2flow is an open-source web application that helps developers visualize and document code by generating UML diagrams automatically from source code. It supports reverse engineering code into various UML diagram types like class diagrams, sequence diagrams, and more.Some key features of Code2flow:Supports major programming languages like Java, C#, Python, PHP,...
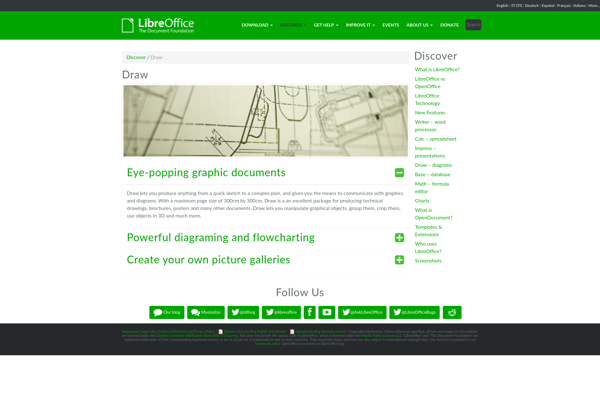
LibreOffice Draw is a vector graphics editor included in the open source LibreOffice software suite. It allows users to create a wide variety of graphical images including diagrams, flowcharts, organizational charts, network layouts, floor plans, and more.As an open source alternative to Microsoft Visio, LibreOffice Draw provides many similar features...
Linkurious is a software designed specifically for graph visualization and network analysis. It allows users to load their network data, such as connections between people, transactions, or communication records, and visualize these connections in an interactive graphical interface.Some key features of Linkurious include:Powerful graph visualization with automatic layouts that spotlight...
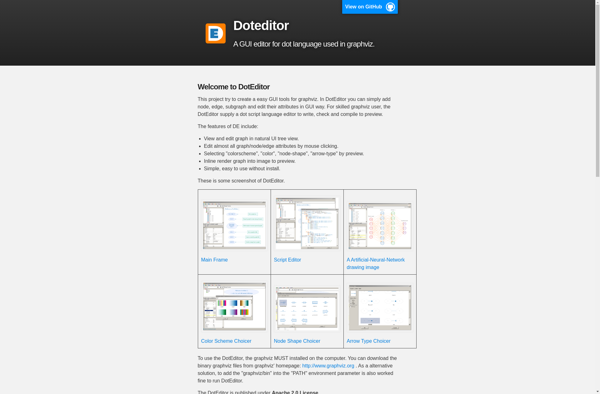
DotEditor is a free, open-source diagramming and vector graphics editor that runs on Windows, Mac, and Linux. It allows users to create a wide variety of diagrams and charts, including flowcharts, UML diagrams, ER diagrams, mind maps, organization charts, network diagrams, and more.Some of the key features and benefits of...
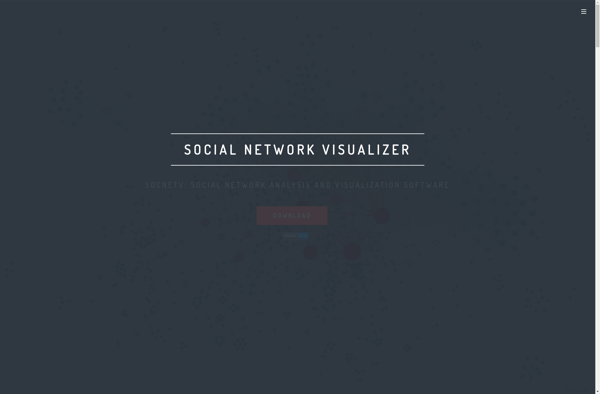
SocNetV is an open-source, cross-platform application for social network analysis and visualization. It enables researchers to construct social networks with nodes and edges representing actors and relationships between them. SocNetV provides a wide range of network statistics and metrics to analyze the structural properties of social networks.Some key features of...
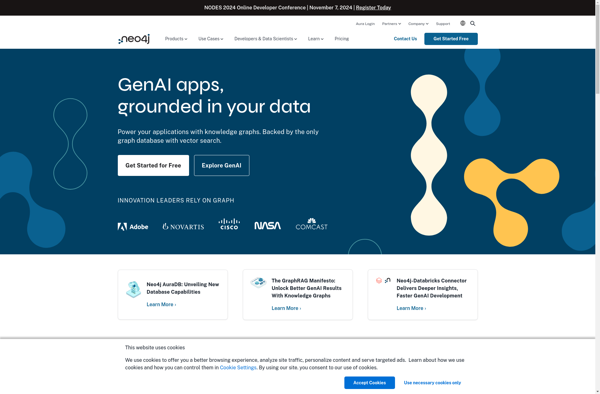
Neoclipse is an open-source integrated development environment (IDE) built on top of the Eclipse platform and tailored for developing applications with the Neo4j graph database. Some key features of Neoclipse include:Graphical schema viewer - Visualize and navigate the node and relationship schema of your Neo4j database.Enhanced Cypher editor - Write...
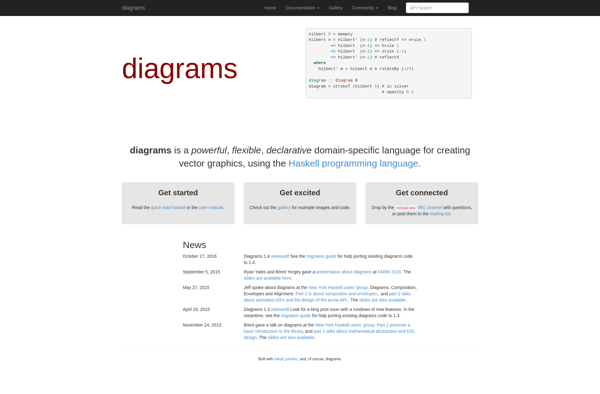
diagrams is a powerful yet easy-to-use diagramming and visualization software. With an intuitive drag-and-drop interface, diagrams allows users to quickly create flowcharts, UML diagrams, network diagrams, mind maps, wireframes, and more.Some key features of diagrams include:Intuitive drag-and-drop interface for quick diagram buildingLarge library of templates and shapesReal-time collaboration allowing multiple...
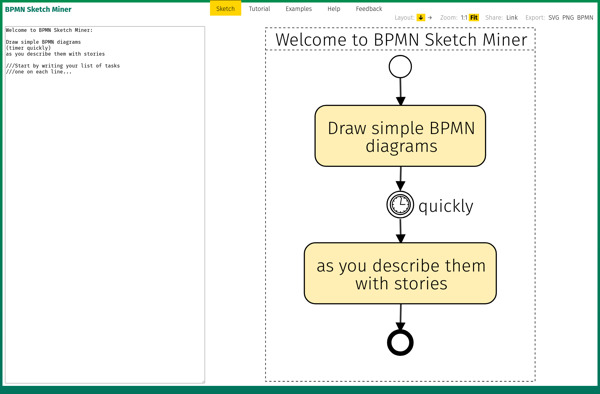
BPMN Sketch Miner is an open-source desktop application designed specifically for business analysts to quickly create Business Process Model and Notation (BPMN) diagrams. It allows users to sketch out process flows using natural drawing gestures and handwriting recognition, which are then converted automatically into standard BPMN 2.0 XML.Some key features...
D3.js, or D3, is an open-source JavaScript library used for visualizing data with web standards. D3 stands for Data-Driven Documents. It allows developers to bind arbitrary data to the Document Object Model (DOM) and then apply data-driven transformations to the document. This allows web developers to create dynamic, interactive data...
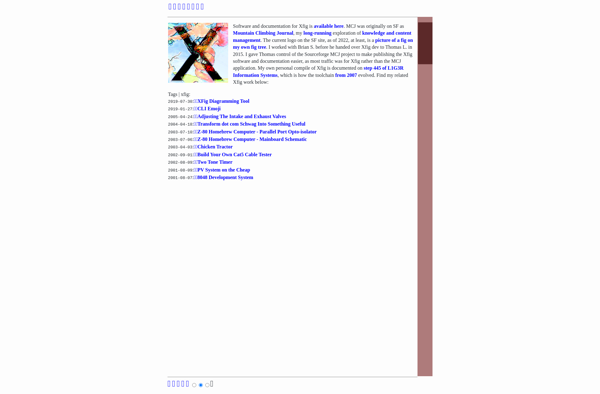
Xfig is an open-source vector graphics editor and diagramming tool that runs on Linux and Unix platforms. It is designed for producing figures for inclusion in documents and presentations. Xfig can be used to draw many different types of diagrams like flowcharts, entity-relationship diagrams, network maps, UML diagrams, and more.Some...
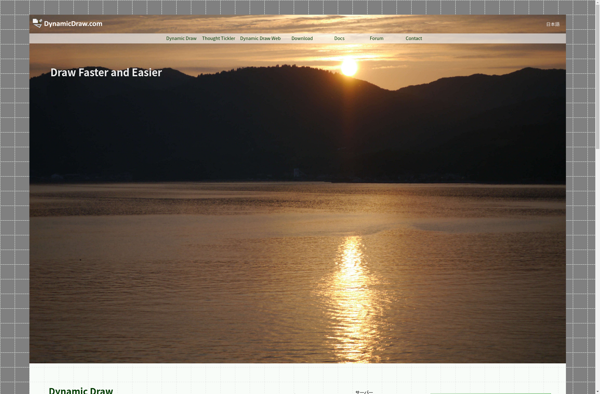
Dynamic Draw is a versatile and user-friendly vector graphics editor available for Windows, macOS, and Linux operating systems. As an open-source application, Dynamic Draw benefits from continual development and improvement from its active community of contributors.With an emphasis on usability and efficiency, Dynamic Draw makes it easy to create 2D...
Asymptote is a powerful declarative vector graphics language for creating technical 2D and 3D drawings and diagrams. It is designed to generate publication-quality figures in PDF or SVG formats.Some key features of Asymptote include:Math-aware - Supports LaTeX expressions and can incorporate mathematical typesetting directly within graphicsProgramming language - Provides control...
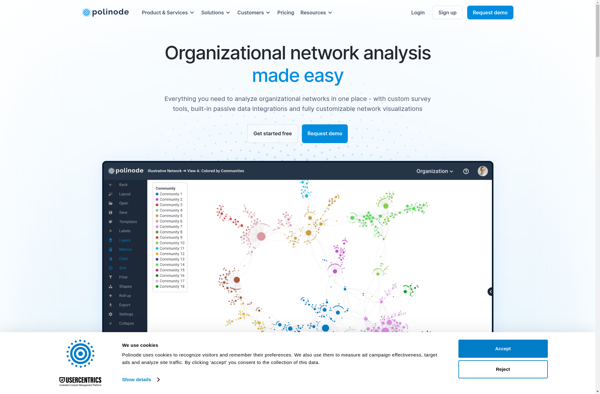
Polinode is an open-source platform aimed at democratizing machine learning and making it more accessible. It allows users to build, train, and deploy machine learning models through a visual no-code interface without needing to write any code.Some key features and benefits of Polinode include:Visual workflow builder with drag-and-drop components for...
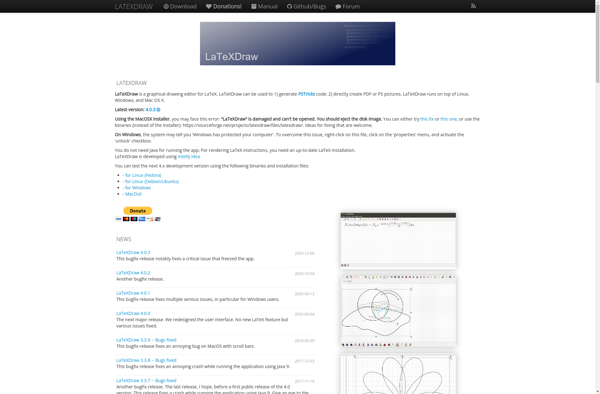
LaTeXDraw is a powerful open-source vector graphics editor and diagramming software that integrates seamlessly with LaTeX documents. It allows users to create various types of drawings such as flow charts, UML diagrams, 2D and 3D graphs, chemical equation diagrams, and more.One of the key features of LaTeXDraw is its ability...
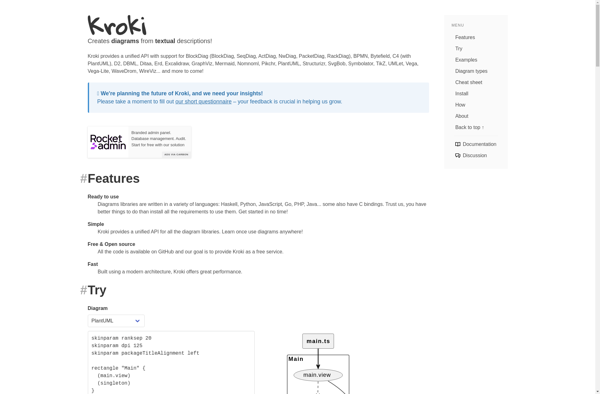
Kroki is an open-source diagram generation tool that allows creating diagrams just by writing simple textual descriptions. It can automatically convert those text descriptions into beautiful diagrams and flowcharts. Kroki supports a wide range of popular diagram types including:Sequence diagramsFlowchartsEntity relationship diagramsState diagramsClass diagramsGantt chartsSome key features and benefits of...
blockdiag is an open-source Python library and command-line tool for generating various types of block-style diagrams from simple text files. It was created to help software developers visualize systems and structures in a simple, fast way without needing to use full-featured diagramming software.Some key features and capabilities of blockdiag include:Supports...
PlantText is an artificial intelligence-powered writing assistant software that helps users generate and expand on content ideas. It utilizes advanced natural language processing to understand text and provide useful writing suggestions.Some key features of PlantText include:Summarization - It can review documents or articles and provide concise summaries.Idea expansion - Users...
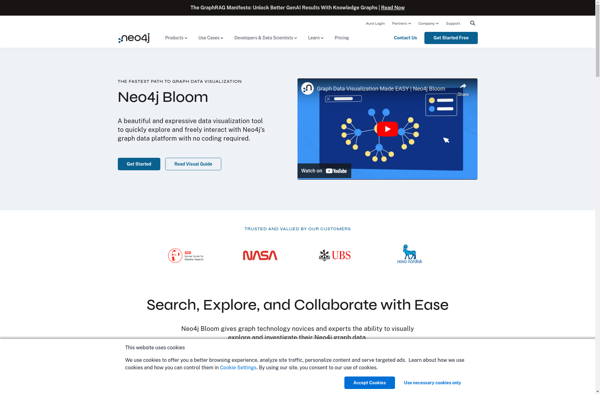
Neo4j Bloom is a desktop application used for graph data visualization, exploration, and analysis. It provides a user-friendly graphical interface for working with graph databases built on the Neo4j platform.Some key features of Neo4j Bloom include:Intuitive graph data visualization with automatic layoutsClick-and-drag exploration of graph structure and relationshipsCustomizable styling and...
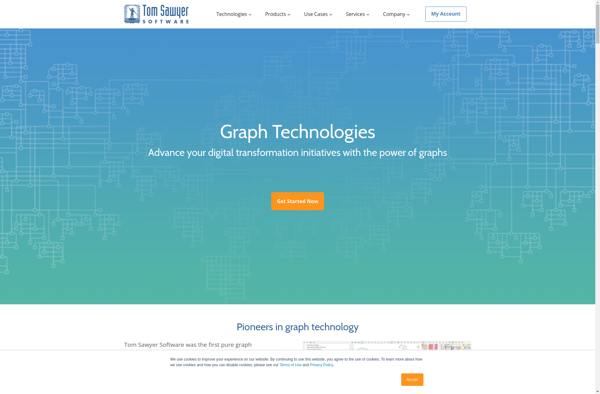
Tom Sawyer Software is an innovative technology platform designed to accelerate the development and integration of complex, distributed software systems involving very large datasets. The software enables enterprises to more efficiently build applications that access data across disparate databases, applications, cloud platforms, and APIs.Key capabilities and benefits of the Tom...
GraphUp is a powerful yet easy-to-use data visualization and analytics software suitable for business users of all backgrounds. With an intuitive drag-and-drop interface, GraphUp makes it simple to connect to data sources, build interactive charts and dashboards, and share analytics and insights with others.Key features of GraphUp include:Flexible drag-and-drop interface...
Gravizo is an open-source diagramming and visualization tool that allows users to create a wide variety of diagrams like flowcharts, sequence diagrams, class diagrams, ER diagrams, Gantt charts, and more using an easy-to-learn text-based domain-specific language. With Gravizo, users write Gravizo script in a text editor, markdown file, or other...
Graphynx is an open-source, cross-platform software tool for graph and network analysis. It enables users to visualize, analyze, and manipulate different types of graph data structures such as social networks, transportation systems, family trees, and more.Key features of Graphynx include:Interactive graph visualization with support for different layout algorithms such as...
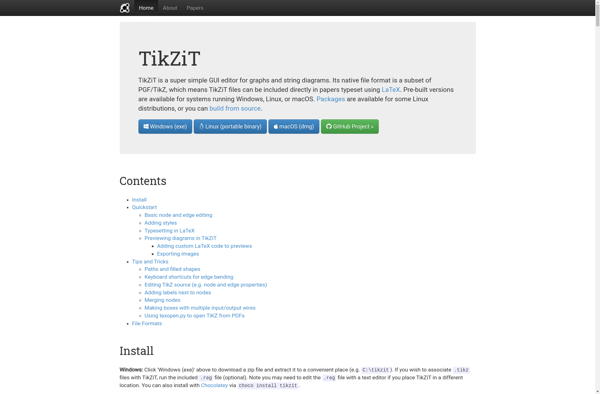
TikZiT is an open-source vector graphics editor designed specifically for creating illustrations and diagrams using TikZ - a domain-specific language for programmatic graphics embedded within LaTeX. TikZiT provides a graphical user interface that allows users to create TikZ graphics intuitively without having to learn TikZ syntax.Some key features of TikZiT...
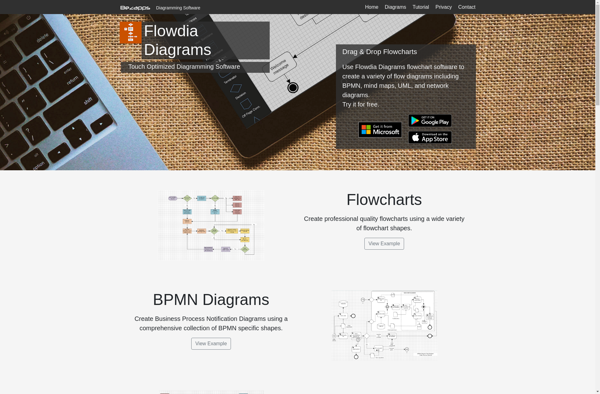
Flowdia Diagrams is a free, open-source desktop application used to create a variety of diagrams like flowcharts, UML diagrams, BPMN diagrams, network diagrams, mocks, and wireframes. It has an easy-to-use drag and drop interface that allows users to quickly draft diagrams by adding elements like shapes, connectors, and text labels...
The Dracula Graph Library is an open-source JavaScript library designed specifically for working with network graph data and visualizations. Developed by Dracula Graph, the library provides a complete set of methods and components for building interactive diagrams, charts, hierarchies, circular networks, and other custom visualizations to represent node and edge...
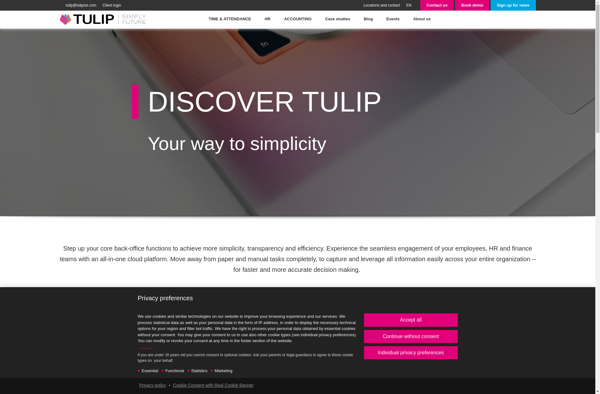
TULIP is an advanced and user-friendly interactive visualization tool for analyzing and visualizing relational data sets. It leverages the power of visual representation to gain insights and make discoveries from complex data.Some key features of TULIP include:Advanced graph visualization with support for different layout algorithms, clustering, filtering etc.Database connectivity for...
Theory Maker is visual thinking software used for brainstorming, mind mapping, concept mapping, and outlining ideas. It provides an intuitive canvas and toolbox that let users quickly capture thoughts and ideas in an organized visual format.Some key features include:Simple and easy-to-use interface for quickly mapping out ideasDiagramming tools for drawing...
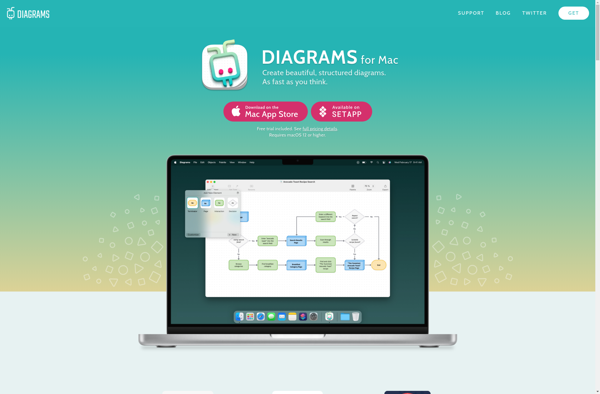
Diagrams for Mac is a feature-rich diagramming and vector graphics application designed specifically for macOS. With an intuitive drag-and-drop interface, Diagrams makes it easy for users to create flowcharts, UML diagrams, website sitemaps, UI wireframes, mind maps, organizational charts, network diagrams, floor plans, electrical schematics, and more.Some key features of...
yFiles for HTML is a feature-complete JavaScript diagramming library designed specifically for web applications and web dashboards. It enables developers to quickly create interactive diagrams, graphs, and network visualizations that run natively in all major web browsers.With yFiles for HTML, you can:Visualize connected data with automatic graph layouts using built-in...
Kenelyze is a customer data platform (CDP) designed to help companies collect, unify, and activate customer data from various sources in order to drive revenue growth, improve marketing effectiveness, and deliver personalized customer experiences across channels.Key capabilities and benefits include:Consolidating customer data from diverse sources like CMS, CRM, mobile apps,...