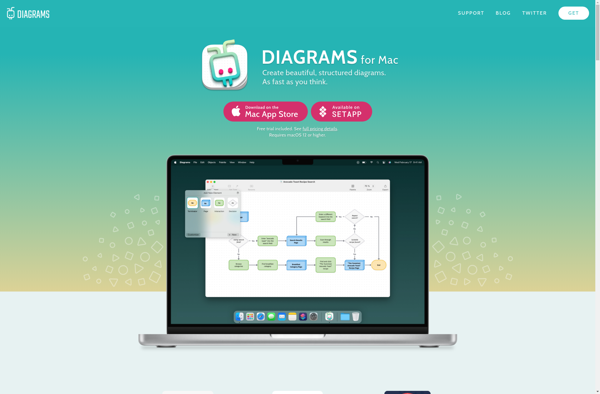
Diagrams for Mac is a vector drawing software for macOS that allows users to create flowcharts, UML diagrams, wireframes, floor plans, and more. It has an intuitive drag-and-drop interface, various styling options, and integrates with third-party apps.
A vector drawing software for macOS offering flowcharts, UML diagrams, wireframes, floor plans & more, with intuitive drag-and-drop interface & styling options
What is Diagrams for Mac?
Diagrams for Mac is a feature-rich diagramming and vector graphics application designed specifically for macOS. With an intuitive drag-and-drop interface, Diagrams makes it easy for users to create flowcharts, UML diagrams, website sitemaps, UI wireframes, mind maps, organizational charts, network diagrams, floor plans, electrical schematics, and more.
Some key features of Diagrams include:
Drag-and-drop functionality to quickly add shapes and elements
An extensive shape library featuring flowchart symbols, network icons, AWS shapes, office motifs, and more
Styling options like color themes, canvas backgrounds, transparency, borders, and shadows
Smart alignment guides, grid snapping, and distribution tools
Drawings remain fully editable and automatically resize to fit content
Cross-platform compatibility to open, edit, and share files with Windows users
Connectors streamline diagram organization by keeping shapes connected when moved
Seamless integration with Office, iWork, cloud drives, Jira, Confluence, and more
Designed as an affordable Visio alternative for Mac, Diagrams is an intuitive diagramming tool for business, educational, and personal project visuals. Its native macOS design allows it to integrate directly into Apple's ecosystem of apps and services.
Diagrams for Mac Features
Features
Drag-and-drop interface for easily creating diagrams
Various diagram types like flowcharts, UML, wireframes, etc
Styling options like themes, fonts, canvas backgrounds
Integrates with third-party apps like Visio, Omnigraffle, etc
Microsoft Office Visio is diagramming and vector graphics software developed by Microsoft. It is used to create a wide variety of business diagrams and visualizations including flowcharts, organizational charts, network diagrams, workflows, floorplans, and more.Key features of Visio include:Hundreds of professionally-designed templates for quick diagram creationIntuitive drag-and-drop interface to easily...
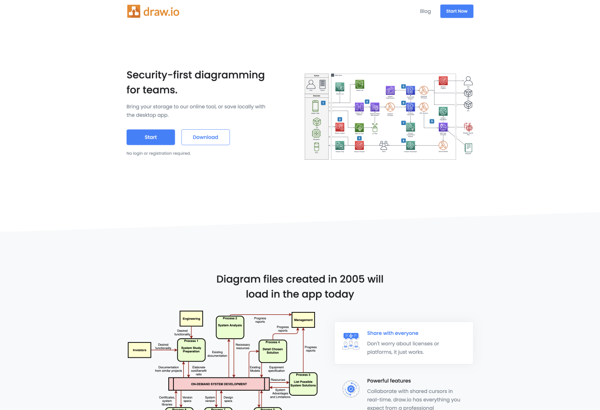
draw.io is a feature-rich diagramming and flowchart software that runs in your web browser. As a freemium tool, draw.io offers a free basic version as well as paid plans with more functionality for professionals and teams.With an intuitive drag-and-drop interface and built-in shape libraries, draw.io makes it easy for anyone...
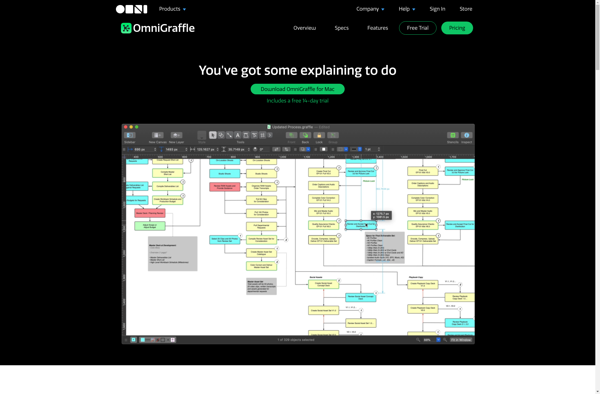
OmniGraffle is a powerful, versatile diagramming application developed by The Omni Group for macOS and iOS. First released in 2001, OmniGraffle enables users to create a wide range of diagrams, charts, illustrations, and graphic documents.With an intuitive and flexible interface, OmniGraffle makes it easy to quickly map out concepts, ideas,...
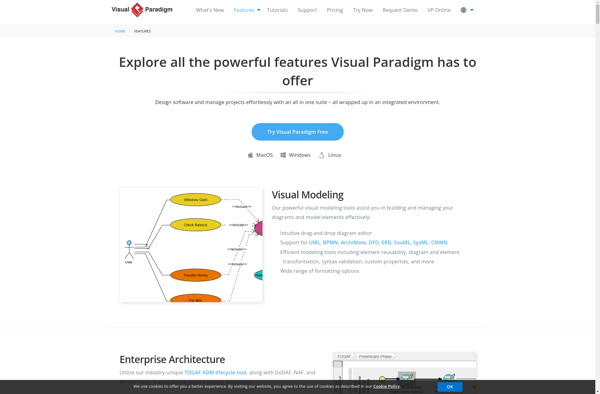
Visual Paradigm is a professional UML modeling software used by software developers and architects for software design and architecture. It supports all standard UML 2.x diagrams like use case diagrams, class diagrams, sequence diagrams, activity diagrams, communication diagrams, state machine diagrams, deployment diagrams, component diagrams, and more.Key features of Visual...
Google Drawings is a free online diagramming and charting tool offered by Google as part of its Google Workspace productivity suite. It allows users to create flowcharts, organizational charts, mind maps, concept maps, site maps, and other types of diagrams.Some key features of Google Drawings include:Intuitive drag-and-drop interface for easily...
yEd Graph Editor is a free, powerful desktop application for Windows, macOS and Linux that can be used to quickly and easily create diagrams. It supports a wide range of diagram types including flowcharts, network diagrams, UML diagrams, BPMN diagrams, mind maps, organization charts, and more.Some key features of yEd...
Graphviz is an open-source graph visualization software package developed by AT&T; Research. It is used for representing structural information as diagrams of abstract graphs and networks.Graphviz allows users to create a variety of graph and network types, including directed graphs, undirected graphs, hierarchies, and more. Some of the key features...
LibreOffice Draw is a vector graphics editor included in the open source LibreOffice software suite. It allows users to create a wide variety of graphical images including diagrams, flowcharts, organizational charts, network layouts, floor plans, and more.As an open source alternative to Microsoft Visio, LibreOffice Draw provides many similar features...
Xmind AI is a mind mapping and brainstorming software application designed to help users organize information visually. It allows users to create maps of ideas, concepts, and relationships between different pieces of information.One of the key features that distinguishes Xmind AI from other mind mapping tools is the integration of...
Whimsical is a cloud-based visual collaboration platform used by product, design, and engineering teams to bring ideas to life. With an easy drag-and-drop interface, Whimsical makes it simple to create engaging flowcharts, wireframes, sticky notes, and diagrams.Key features of Whimsical include:Intuitive editing tools for quickly building visually engaging documents like...
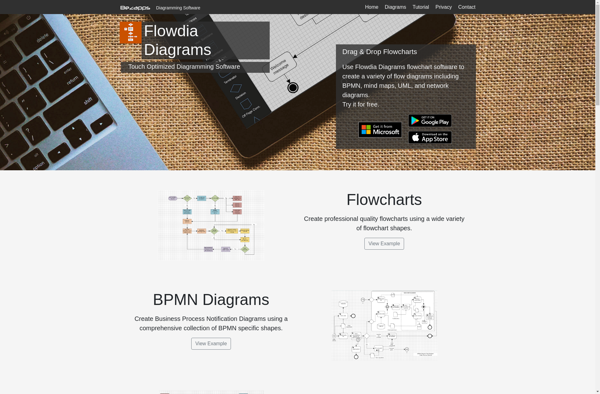
Flowdia Diagrams is a free, open-source desktop application used to create a variety of diagrams like flowcharts, UML diagrams, BPMN diagrams, network diagrams, mocks, and wireframes. It has an easy-to-use drag and drop interface that allows users to quickly draft diagrams by adding elements like shapes, connectors, and text labels...