Asymptote: The Vector Graphics Language
Asymptote: The Vector Graphics Language
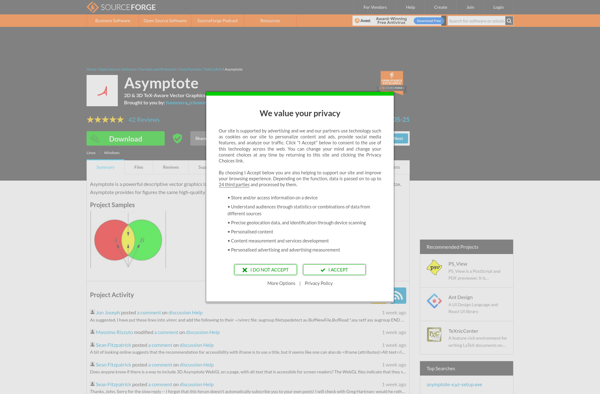
An open-source descriptive vector graphics language for technical drawing, producing high-quality 2D and 3D graphics figures like diagrams, schematics, and illustrations.
What is Asymptote: The Vector Graphics Language?
Asymptote is a powerful declarative vector graphics language for creating technical 2D and 3D drawings and diagrams. It is designed to generate publication-quality figures in PDF or SVG formats.
Some key features of Asymptote include:
- Math-aware - Supports LaTeX expressions and can incorporate mathematical typesetting directly within graphics
- Programming language - Provides control structures and data types to generate complex graphics programmatically
- 2D/3D graphics - Capable of producing both 2D vector graphics as well as detailed 3D scenes with surfaces, lighting, etc.
- High-quality output - Rendering and typography on par with TeX/LaTeX typesetting
- Portability - Output format is PDF or SVG for inclusion in LaTeX, HTML5, ebooks, and more
- Extensibility - New modules can be added using C++ or other languages
- Free and open source software written in C++
Some uses of Asymptote include technical illustrations, 3D data visualization, architectural drawings, electronic circuit schematics, mapping diagrams, chemical structure diagrams, and complex graphs/plots requiring precise mathematical typesetting.
Asymptote: The Vector Graphics Language Features
Features
- Vector graphics language
- Can produce 2D and 3D graphics
- Has a simple coding interface
- Good for technical drawings, diagrams, schematics, illustrations
- Built-in CAD-like drawing capabilities
- Powerful descriptive programming language
Pricing
- Open Source
Pros
Cons
Official Links
Reviews & Ratings
Login to ReviewNo reviews yet
Be the first to share your experience with Asymptote: The Vector Graphics Language!
Login to ReviewThe Best Asymptote: The Vector Graphics Language Alternatives
View all Asymptote: The Vector Graphics Language alternatives with detailed comparison →
Top Photos & Graphics and Vector Graphics and other similar apps like Asymptote: The Vector Graphics Language
Here are some alternatives to Asymptote: The Vector Graphics Language:
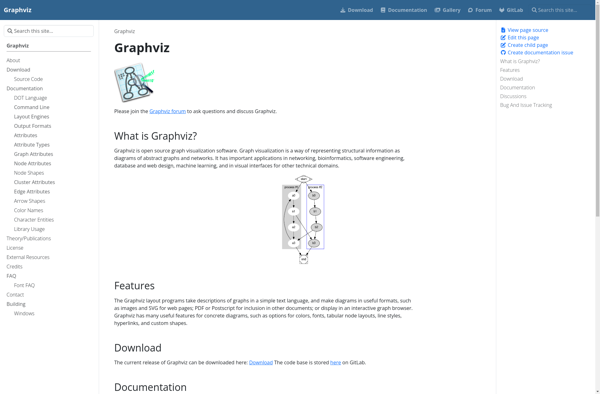
Suggest an alternative ❐Graphviz
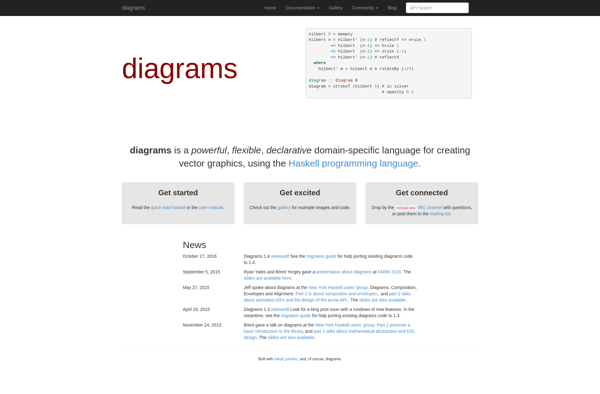
Diagrams
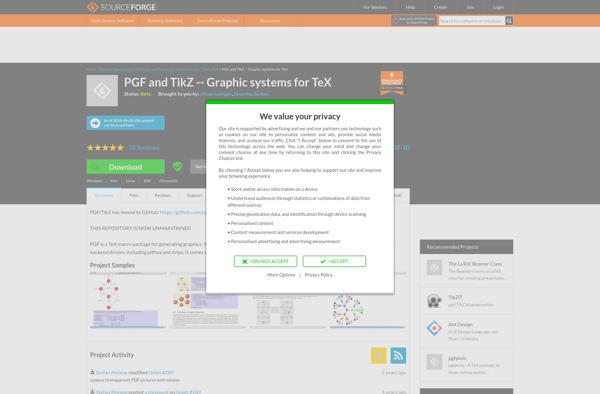
PGF and TikZ
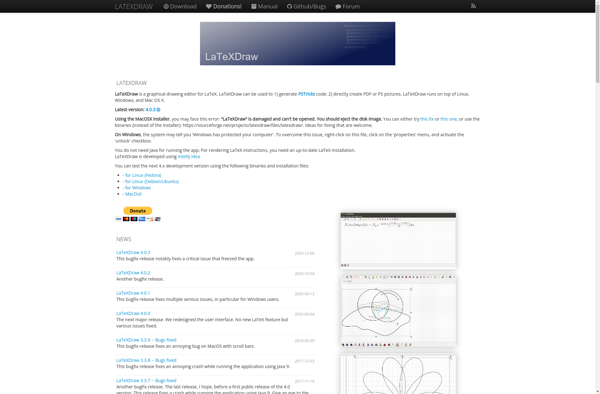
LaTeXDraw
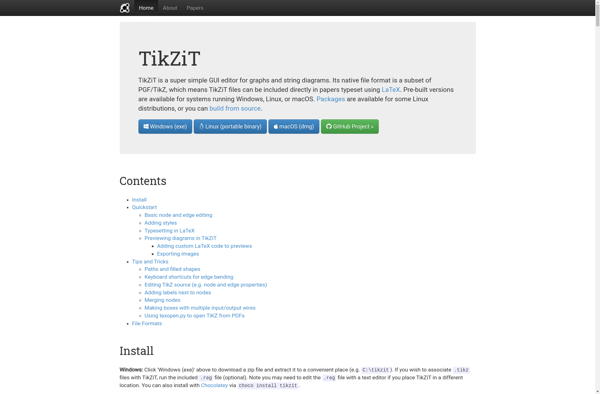
TikZiT