TULIP
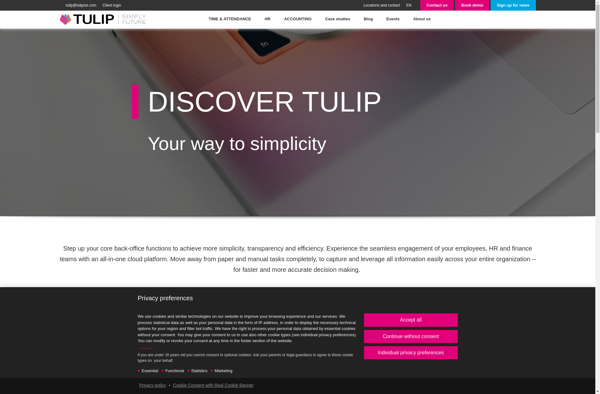
TULIP: Open-Source Data Analysis & Visualization Tool
Discover the powerful TULIP software for relational data analysis and visualization, now available on Suggest.
What is TULIP?
TULIP is an advanced and user-friendly interactive visualization tool for analyzing and visualizing relational data sets. It leverages the power of visual representation to gain insights and make discoveries from complex data.
Some key features of TULIP include:
- Advanced graph visualization with support for different layout algorithms, clustering, filtering etc.
- Database connectivity for importing and analyzing SQL and CSV datasets
- Interactive data exploration with ability to select, navigate, manipulate both data and its visual representation
- Customizable visual encoding of data attributes through size, shape, color coding of nodes and edges
- Scripting and plugin capabilities for advanced customization and extensibility
- Exporting images, videos and advanced vector graphics of visualized data
TULIP is aimed at researchers, analysts and developers dealing with relational datasets who want to go beyond analyzing spreadsheets to interactively visualize, explore patterns and gain intuitive insights from such data. Its advanced features coupled with an intuitive user interface makes it a great open-source alternative to commercial network analysis and data visualization tools.
TULIP Features
Features
- Interactive data exploration and visualization
- Supports relational datasets
- Link analysis and graph visualization
- Clustering algorithms
- Customizable visual encodings
- Scriptable via Python
Pricing
- Open Source
Pros
Cons
Official Links
Reviews & Ratings
Login to ReviewThe Best TULIP Alternatives
View all TULIP alternatives with detailed comparison →
Top Ai Tools & Services and Data Analysis and other similar apps like TULIP
Here are some alternatives to TULIP:
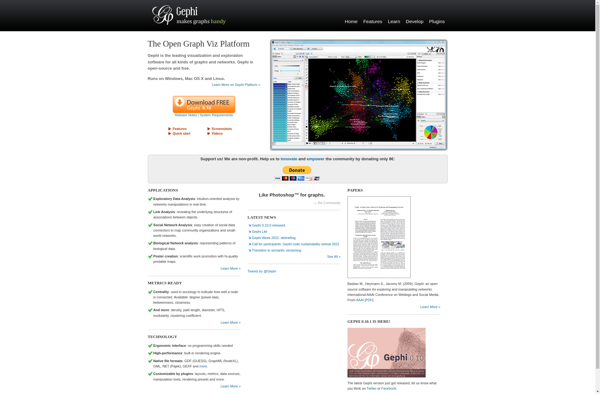
Suggest an alternative ❐Gephi
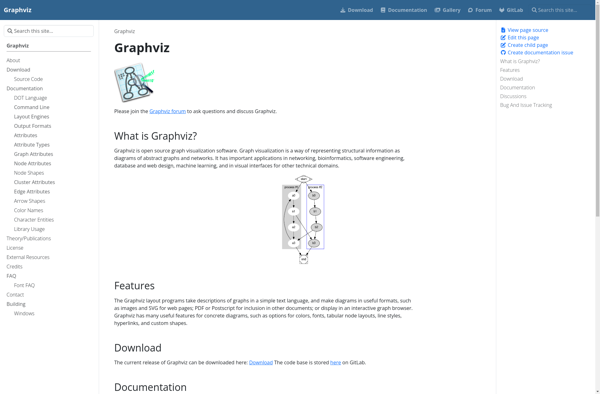
Graphviz
YFiles for HTML
Kenelyze