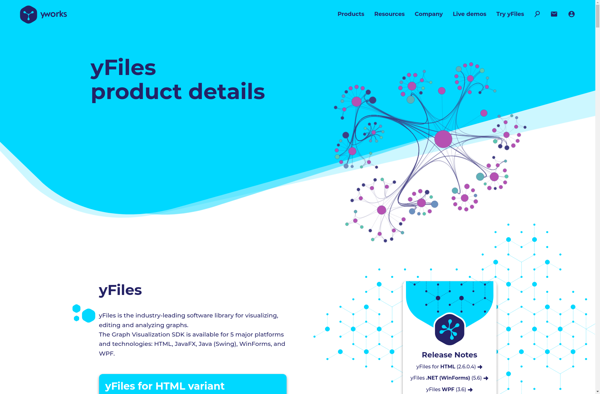
YFiles for HTML
yFiles for HTML is a JavaScript diagramming library for creating interactive graph and diagramming applications in web browsers. It provides layout algorithms, graph analysis tools, and visualization components optimized for HTML5.
yFiles for HTML: Interactive Graph Diagramming Library
yFiles for HTML is a JavaScript diagramming library for creating interactive graph and diagramming applications in web browsers. It provides layout algorithms, graph analysis tools, and visualization components optimized for HTML5.
What is YFiles for HTML?
yFiles for HTML is a feature-complete JavaScript diagramming library designed specifically for web applications and web dashboards. It enables developers to quickly create interactive diagrams, graphs, and network visualizations that run natively in all major web browsers.
With yFiles for HTML, you can:
- Visualize connected data with automatic graph layouts using built-in layout algorithms like hierarchical, organic, circular, balloon, and force-directed
- Analyze graph metrics like clusters, centrality, cycles, connectivity, etc. with graph analysis components
- Easily create interactive diagrams like flowcharts, org charts, mind maps, and BPMN with dedicated diagramming components
- Seamlessly integrate diagrams into your web applications with React, Angular, and Vue components
- Customize the look and feel of nodes, edges, groups, labels and provide rich tooltips and context menus
- Enable features like highlighting, animation, expand/collapse, and interactive editing
Key features include: automatic layout, interactive visualization and editing, analysis, custom styling, navigation, export, clipboard and tooltips.
YFiles for HTML Features
Features
- Interactive diagramming
- Automatic layout algorithms
- Graph analysis tools
- Visualization components optimized for HTML5
Pricing
- Freemium
- Subscription-Based
Pros
Runs natively in web browsers
Rich set of features for diagramming
Good performance even for large graphs
Integrates well with modern web frameworks
Cons
Limited to web deployment
Steep learning curve
Expensive commercial license
Reviews & Ratings
Login to ReviewThe Best YFiles for HTML Alternatives
View all yFiles for HTML alternatives with detailed comparison →
Top Development and Diagramming & Modeling and other similar apps like YFiles for HTML
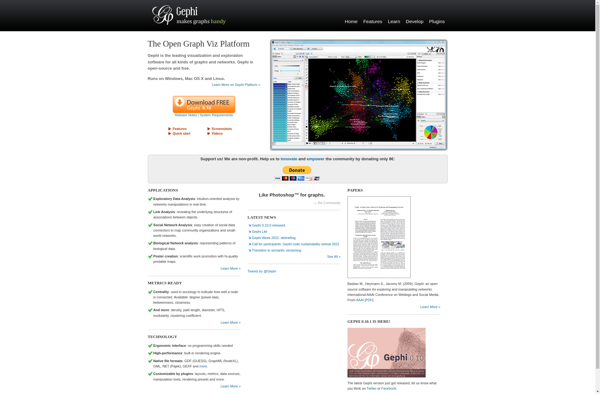
Gephi
Gephi is an open-source, cross-platform network analysis and visualization software package developed in Java. It allows users to visualize, interactively explore, spatially arrange, manipulate, and statistically analyze network graphs made up of nodes and edges. Gephi provides easy and broad access to complex network data in order to help applied...
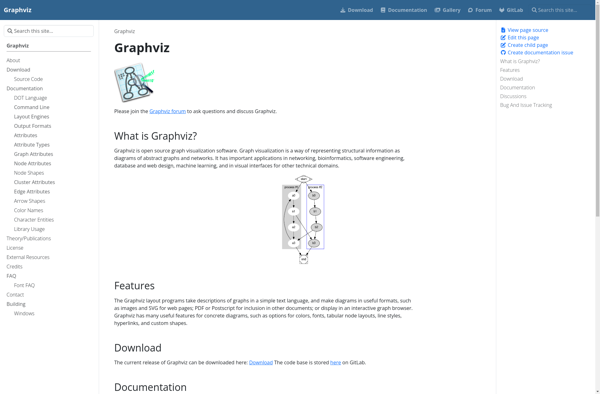
Graphviz
Graphviz is an open-source graph visualization software package developed by AT&T; Research. It is used for representing structural information as diagrams of abstract graphs and networks.Graphviz allows users to create a variety of graph and network types, including directed graphs, undirected graphs, hierarchies, and more. Some of the key features...
TULIP
TULIP is an advanced and user-friendly interactive visualization tool for analyzing and visualizing relational data sets. It leverages the power of visual representation to gain insights and make discoveries from complex data.Some key features of TULIP include:Advanced graph visualization with support for different layout algorithms, clustering, filtering etc.Database connectivity for...