Neo4j Bloom

Neo4j Bloom

Neo4j Bloom is a graph visualization and exploration tool for Neo4j databases. It allows users to easily view, navigate, explore, and analyze graph data visually in an intuitive UI.
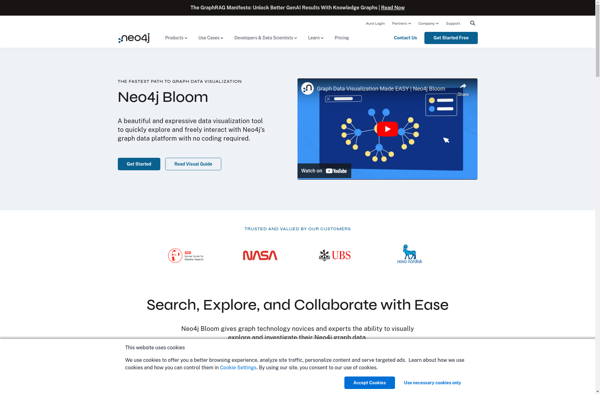
Neo4j Bloom image
graph visualization exploration neo4j

Neo4j Bloom: Graph Visualization and Exploration Tool

Neo4j Bloom is a graph visualization and exploration tool for Neo4j databases. It allows users to easily view, navigate, explore, and analyze graph data visually in an intuitive UI.

What is Neo4j Bloom?

Neo4j Bloom is a desktop application used for graph data visualization, exploration, and analysis. It provides a user-friendly graphical interface for working with graph databases built on the Neo4j platform.

Some key features of Neo4j Bloom include:

  • Intuitive graph data visualization with automatic layouts
  • Click-and-drag exploration of graph structure and relationships
  • Customizable styling and formatting of nodes and relationships
  • Filtering, searching, and highlighting graph data
  • Analytics tools like centrality metrics and clustering algorithms
  • Exporting graphs as images or Cypher code
  • Integrated database browser for running Cypher queries

Neo4j Bloom enables anyone to tap into the power of graph visualization for better graph data analysis and interpretation, without needing to write code. It makes Neo4j graph databases more accessible for understanding connected data across many domains like network security, knowledge graphs, social networks, and more.

Neo4j Bloom Features

Features

  1. Graph visualization
  2. Graph exploration
  3. Visual analysis of graph data
  4. Intuitive user interface

Pricing

  • Freemium

Pros

Easy to view graph data visually

Allows intuitive navigation and exploration of graphs

Good for analyzing connections in graph data

User-friendly interface

Cons

Limited to Neo4j databases

Less customizable than other graph visualization tools

Not suitable for large or complex graph data


The Best Neo4j Bloom Alternatives

Top Development and Databases and other similar apps like Neo4j Bloom


Gephi icon

Gephi

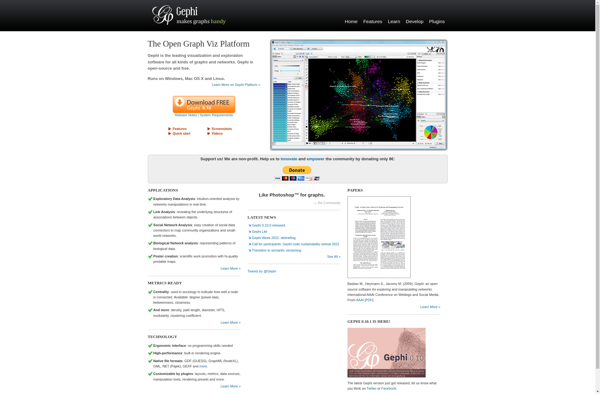
Gephi is an open-source, cross-platform network analysis and visualization software package developed in Java. It allows users to visualize, interactively explore, spatially arrange, manipulate, and statistically analyze network graphs made up of nodes and edges. Gephi provides easy and broad access to complex network data in order to help applied...
Gephi image
Graphviz icon

Graphviz

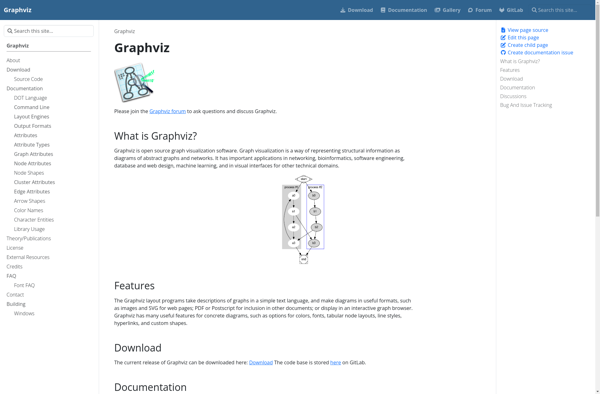
Graphviz is an open-source graph visualization software package developed by AT&T; Research. It is used for representing structural information as diagrams of abstract graphs and networks.Graphviz allows users to create a variety of graph and network types, including directed graphs, undirected graphs, hierarchies, and more. Some of the key features...
Graphviz image
Linkurious icon

Linkurious

Linkurious is a software designed specifically for graph visualization and network analysis. It allows users to load their network data, such as connections between people, transactions, or communication records, and visualize these connections in an interactive graphical interface.Some key features of Linkurious include:Powerful graph visualization with automatic layouts that spotlight...
Linkurious image
KeyLines Graph Visualization Toolkit icon

KeyLines Graph Visualization Toolkit

KeyLines is an open-source JavaScript library for creating interactive network and graph visualizations on the web. It is designed to allow developers to easily generate node-link diagrams, charts, and graphs from data sources like JSON and CSV.Some key features of KeyLines include:Generates common graph layouts like force-directed, circular, tree, etc.Customizable...
KeyLines Graph Visualization Toolkit image
Sentinel Visualizer icon

Sentinel Visualizer

Sentinel Visualizer is a powerful business intelligence and data visualization software used to create stunning, interactive dashboards and data stories from complex data sets. It provides an easy-to-use drag and drop interface, allowing non-technical users to quickly visualize their data and share actionable insights across the organization.Key features include:Interactive dashboards...
Sentinel Visualizer image
Hume icon

Hume

Hume is an open-source virtual assistant designed to help users be more productive. It allows you to have natural language conversations to complete tasks such as scheduling meetings, taking notes, setting reminders, and more.Some key features of Hume include:Natural language processing - Hume understands plain English requests and responds conversationallyCalendar...
Hume image
Tom Sawyer Software icon

Tom Sawyer Software

Tom Sawyer Software is an innovative technology platform designed to accelerate the development and integration of complex, distributed software systems involving very large datasets. The software enables enterprises to more efficiently build applications that access data across disparate databases, applications, cloud platforms, and APIs.Key capabilities and benefits of the Tom...
Tom Sawyer Software image
Agens Browser icon

Agens Browser

Agens Browser is a relatively new web browser that emphasizes privacy protection and ad blocking. Developed by a small team based in Estonia, Agens Browser blocks online ads, cross-site trackers, and some JavaScript by default to prevent user data collection.Key features of Agens Browser include:Built-in ad blocker and anti-tracking protection...
Agens Browser image