D3.js is a JavaScript library for visualizing data with HTML, SVG, and CSS. It allows developers to bind arbitrary data to DOM elements and apply data-driven transformations to the document. Common uses are for creating interactive graphs, charts, maps, and data visualizations.
D3.js is a JavaScript library for visualizing data with HTML, SVG, and CSS. It allows developers to bind arbitrary data to DOM elements and apply data-driven transformations to the document. Common uses are for creating interactive graphs, charts, maps, and data visualizations.
What is D3.js?
D3.js, or D3, is an open-source JavaScript library used for visualizing data with web standards. D3 stands for Data-Driven Documents. It allows developers to bind arbitrary data to the Document Object Model (DOM) and then apply data-driven transformations to the document. This allows web developers to create dynamic, interactive data visualizations in web browsers.
D3 is extremely flexible and enables developers to create many types of visualizations like charts, graphs, maps, networks and more. It uses SVG, HTML5 and CSS standards for rendering visualizations in modern web browsers without proprietary frameworks. D3 visualizations can respond dynamically to user events and new data. Visualizations made with D3 are portable to all major modern web and mobile browsers.
Some of the key capabilities of D3 include:
Binding arbitrary data to the DOM
Applying data transformations and generating new DOM elements based on data
Powerful selections and transformations using chaining syntax
Animations and transitions for interactions and changes over time
Support for widely-implemented web standards like HTML, SVG and CSS
An emphasis on web standards and portability where possible over proprietary formats
The ability to generate dynamic, interactive, animated data visualizations
D3 is designed to be easy to get started with, but allows great flexibility and customization. It enables developers to build visualizations exactly to their needs. D3 has been widely adopted and used by companies, organizations and publications like the New York Times, FiveThirtyEight, and more.
Google Charts is a robust and flexible JavaScript charting and data visualization library provided for free by Google. It offers developers a highly customizable way to create interactive charts, graphs, and data tables that seamlessly integrate into web pages and applications.With Google Charts, you can visualize complex data sets and...
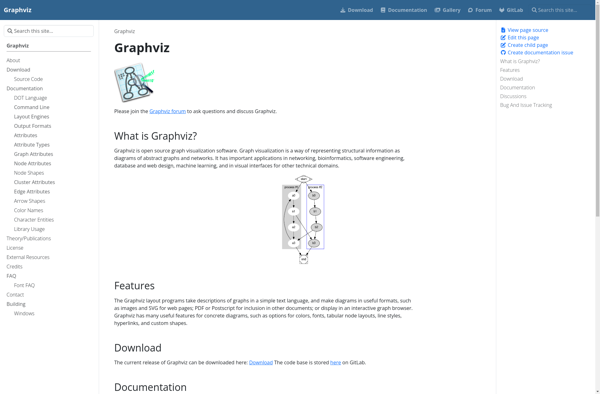
Graphviz is an open-source graph visualization software package developed by AT&T; Research. It is used for representing structural information as diagrams of abstract graphs and networks.Graphviz allows users to create a variety of graph and network types, including directed graphs, undirected graphs, hierarchies, and more. Some of the key features...
Plotly is an open-source graphing library that allows users to create interactive, publication-quality graphs, charts, and dashboards. It supports Python, R, JavaScript, and Excel as programming languages. Some key features of Plotly include:Interactive visualization - Plotly charts are interactive with features like hover text, zooming, panning, selectable legends, and editable...
Highcharts is an advanced JavaScript charting library used to visualize data and create interactive charts and graphs in web applications. Originally developed in 2009 by Highsoft AS, Highcharts allows developers to quickly add charts and graphs to their web pages with support for a wide variety of chart types out...
Datamatic.io is a cloud-based no-code data pipeline platform that allows users to build data integration, transformation, and loading processes without needing to write any code. Some key features of Datamatic.io include:Graphical interface to visually design data pipelines by connecting various pre-built data source and destination connectors as well as transformation...
SAP BusinessObjects is a comprehensive business intelligence and analytics software suite from SAP. It brings together capabilities for reporting, analysis, dashboards, data visualization, data discovery, and more to help organizations unlock value from their data.Key capabilities and components of SAP BusinessObjects include:Centralized semantic layer for consistent data across the organizationPowerful...
Chart.js is an open-source JavaScript library that allows developers to easily create responsive, interactive data visualizations and charts using HTML5 Canvas. Some key things to know about Chart.js:Supports 8 chart types out of the box: line, bar, radar, polar, pie, doughnut, scatter, and bubble chartsUses HTML5 Canvas for rendering charts,...
ChartBlocks is a business intelligence and data visualization software used to create interactive charts, dashboards, and reports for better data analysis. It provides an easy drag-and-drop interface to build visualizations quickly without the need for coding.Some key features of ChartBlocks include:Drag-and-drop functionality to create various charts like bar, line, pie,...
amCharts is a feature-rich JavaScript charting library that enables you to create interactive charts, dashboards, and data visualizations. With amCharts, you can build solutions for both web and mobile platforms.Some key capabilities and benefits of amCharts include:Supports a wide variety of chart types: line, column, bar, pie, radar, scatter, gauges,...
C3.js is an open-source JavaScript library for generating clear and attractive charts. It is a wrapper built on top of D3.js that simplifies common chart types like line, bar, pie, scatter, stacked graphs, etc. The goal is to provide an easy way for web developers to visualize data without writing...
Open Flash Chart is an open-source JavaScript charting library used to create interactive Flash-based charts for web applications. It provides an easy way for developers to add advanced data visualizations and graphs to their websites without needing to write Flash code.Some key features of Open Flash Chart include:Support for various...
NVD3 is an open-source JavaScript charting library used to build interactive data visualizations in web browsers. It is based on D3.js and reuses parts of the D3 codebase to create reusable charts. NVD3 aims to simplify and streamline D3 code for faster web development.Some key features of NVD3 include:Over a...
dc.js is a JavaScript charting library that leverages d3.js and crossfilter for interactive dimensional charting and visual analysis of large datasets. Some key features of dc.js include:Integration with d3.js for powerful and flexible visualizationsTight integration with crossfilter for fast filtering and grouping of large datasetsFocus+Context and Brushing chart interactionsAnimated transitions...
Bokeh is an open-source Python library for creating interactive data visualizations for modern web browsers. It allows users to quickly construct versatile and high-performance graphics from simple plots to complex dashboards. Some key features of Bokeh include:Integration with common Python data science libraries like NumPy, Pandas, Scikit-Learn for easy data...
ZoomCharts is a feature-rich JavaScript charting library used to create interactive data visualizations for web applications and dashboards. With over 90 chart types to choose from, including line, bar, pie, map, scatter, and more, ZoomCharts provides the flexibility to represent data in a meaningful way.Some of the key capabilities and...
Chartist.js is a lightweight, open-source charting library built with SVG. It was designed to be simple, responsive, and highly customizable using CSS and SVG animations.Some key features of Chartist.js include:Supports line, bar, pie and other chart typesAnimated chart transitions and interactionsResponsive - charts adapt to any screen sizeHighly customizable with...
ApexCharts is an open source JavaScript charting library aimed at providing simple yet highly customizable plots for web applications. Released in 2018, ApexCharts enables developers to rapidly build rich visualizations with ease and maintainability.Some key capabilities and benefits of ApexCharts include:Support for a wide variety of chart types - line,...
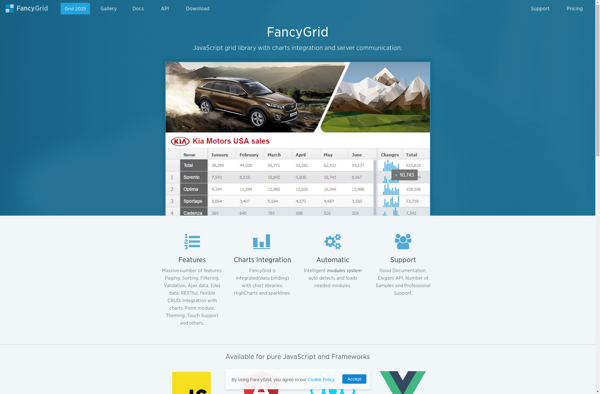
FancyGrid is a powerful yet easy-to-use spreadsheet software and data visualization tool for analyzing, visualizing and sharing data. It provides a variety of features:User-friendly spreadsheet interface for entering, formatting and calculating data.Hundreds of charts and graph types to visualize data, reveal patterns and turn numbers into actionable insights.Interactive dashboards to...
Processing.js is an open-source JavaScript port of the popular Processing visualization programming language and environment. It allows web browsers to display animations, visualizations, and interactions using the Processing syntax and graphical capabilities.Some key features of Processing.js include:Works with modern web browsers like Chrome, Firefox, and SafariSupports 2D and 3D graphics,...
Picasso.js is an open-source JavaScript charting library built on top of the HTML5 Canvas element. It provides a simple yet powerful API for easily creating rich and interactive data visualizations and charts in the browser.Some of the key features of Picasso.js include:Supports a wide variety of chart types out of...
Vis.js is an open source data visualization library built with JavaScript. It allows developers to create interactive visualizations such as timelines, networks and graphs easily in the browser using web standards.Some of the key features of Vis.js include:Various data visualization modules for timelines, networks, graphs etc.Easily customizable and extensible to...
Charts 4 PHP is an open-source and free PHP charting library that allows developers to create interactive charts, graphs and data visualizations using PHP. It provides an easy way to visualize data on web applications and sites built with PHP.Some key features of Charts 4 PHP:Supports various chart types including...
liveGap Charts is an open-source JavaScript charting library used to build customizable, interactive data visualizations for the web. Developed by liveGap's engineering team, it was designed to provide an intuitive way to visualize data and create rich user experiences.Some key features of liveGap Charts include:Support for a wide variety of...
Vega-Lite is a high-level visualization grammar built on top of the Vega visualization grammar. It provides a concise, human-readable JSON syntax for creating visualizations by specifying mappings from data fields to visual channels such as x, y, color, and size.Some key capabilities and benefits of Vega-Lite include:Rapid generation of visualizations...
Smoothie Charts is an open-source JavaScript charting library designed specifically for real-time streaming data visualization. Some key features include:Optimized for line, bar, scatter, spline, and area graphs using canvasFast animation with a small code footprint suitable for embedded devicesHandles large volumes of real-time data without dropping framesCustomizable scales, interpolation modes,...
Frappé Charts is an open source data visualization library built on Python and JavaScript. It offers a wide variety of interactive charts and graphs including line, area, bar, pie, donut, scatter, heat maps and more. The key features of Frappé Charts include:Simple and intuitive drag-and-drop interface to create visualizationsSupport for...
Koia is an open-source, self-hosted alternative to Canva's web-based graphic design platform. Like Canva, Koia provides an intuitive drag-and-drop interface and a wide range of templates and design assets to help users with no design experience easily create stunning graphics, presentations, posters, brochures, resumes, invitations and more for business, education,...
Angoss KnowledgeSEEKER is a comprehensive data mining and predictive analytics platform used to uncover patterns and relationships in data to improve decision making. It helps organizations leverage their data by providing capabilities for:Data preparation and cleansing - KnowledgeSEEKER provides tools to profile, cleanse, transform, aggregate, sample, and partition data to...
morris.js is an open-source JavaScript charting library that allows for simple creation of responsive, stylish charts and graphs. Some key features include:Light-weight and customizable architecture based on jQuery and Raphaël for cross-browser compatibilitySupports SVG, Canvas and CSS rendering for graphs and chartsOffers a variety of chart types - line, bar,...
InfoCaptor Dashboard is a business intelligence and analytics platform designed to help companies consolidate their data, create customized dashboards and reports, and uncover valuable insights. Some key features of InfoCaptor Dashboard include:Data connectivity and ETL - Connect to data from multiple sources like SQL and NoSQL databases, cloud apps, Excel,...
RGraph is an open source JavaScript charting library that allows developers to add interactive, customizable charts and graphs to web pages without needing a charting server backend. It is lightweight, easy to implement, and supports over 30 chart types including line, bar, pie, scatter, waterfall, funnel charts and more.Some key...
uvCharts is an open-source JavaScript charting library for building interactive data visualizations for the web. Some key features and benefits of uvCharts include:Open source and completely free to useLightweight at only 15kB gzippedSupports a wide variety of chart types including line, bar, pie, scatter, area charts and moreExtensive customization options...
RAWGraphs is a free, open-source web tool created for anyone to easily visualize and share data using the most common graphical formats. The simple drag and drop interface makes it easy for non-experts to quickly generate a wide variety of charts and diagrams that can be exported and shared as...
GraphicsJS is a feature-rich JavaScript graphics library for the HTML5 canvas element. It provides an easy-to-use API for generating, manipulating and animating graphics in the browser with JavaScript.Some of the key features of GraphicsJS include:Intuitive interface for drawing basic shapes like rectangles, circles, lines, polygons, as well as advanced shapes...
Datacopia is an open-source data workflow and pipeline tool designed for integrating, moving, and transforming data across databases, data warehouses, lakes, and other systems. It provides an easy to use visual interface to build and manage complex data pipelines without coding.Key features of Datacopia include:Visual data pipeline designer to model...
Chartkick is an open-source charting library for Ruby on Rails applications. It provides a simple domain-specific language for generating interactive charts and graphs without writing any JavaScript. Chartkick supports various chart types like line charts, pie charts, column charts, bar charts and more.Some key features of Chartkick:Easy integration into Rails...
Birst is a cloud-native business intelligence and analytics platform used by enterprises to unify, understand, and act on data. Key capabilities and benefits include:Cloud data warehousing to bring together data from multiple sources for analysisInteractive dashboards and visualizations to spot trends and insightsSelf-service analytics empowering users across the organization to...
The Epoch Charting Library is an open-source JavaScript charting library designed for building a wide range of interactive browser-based data visualizations. It provides a simple yet powerful API for defining chart types like bar charts, line charts, scatter plots, pie charts, area plots, and more. The library handles details like...
Ember Charts is an open-source JavaScript charting library built for use in Ember.js applications. It provides a set of reusable Ember components and services to help developers quickly add beautiful, interactive charts and graphs to their apps.Key features of Ember Charts include:Tight integration with Ember's data layer - easily bind...
ArcadiaCharts is an open-source JavaScript charting library for building interactive data visualizations for the web. With ArcadiaCharts, you can create various types of charts like line charts, bar charts, pie charts, scatter plots, area charts, and more.Some key features and capabilities of ArcadiaCharts include:Support for animation and transitions for more...
ggvis is an R package developed by RStudio for building interactive data visualizations. It allows users to create rich graphics and plots that can be embedded in web pages and applications. Some key features of ggvis include:Builds on the popular ggplot2 graphics package in R, so it is easy for...
Chart Templates is charting software that provides a library of pre-designed chart and graph templates that can be customized to visualize data. It helps non-designers easily create professional, on-brand data visualizations for business uses.The software includes hundreds of templates for all types of charts - from basic bar, lines and...
D3plus is an open-source JavaScript library that builds on top of D3.js to facilitate the creation of rich, interactive data visualizations and dashboards with minimal code. It was developed to extend the low-level functionality of D3 with higher-level abstractions, intuitive APIs, reusable components and templates to enable faster and easier...
n3-charts is a feature-rich JavaScript charting library for adding interactive data visualizations to web apps and sites. Developed with focus on performance, customizability and ease-of-use, n3-charts allows developers to quickly build various types of charts and graphs to effectively visualize data.With n3-charts, you can create line, bar, column, area, pie,...
AnyChart is a feature-rich JavaScript charting library that enables developers to easily add interactive charts and dashboards to web and mobile applications. With its lightweight architecture, AnyChart aims to provide high performance chart rendering optimized even for large datasets.AnyChart supports over 80 chart types including column, bar, line, area, pie,...
PykCharts.js is an open source JavaScript charting library for building highly customizable and interactive data visualizations and charts using web technologies. It is built on top of the popular D3.js library.Key features of PykCharts include:Support for various chart types like line, bar, pie, donut, scatter, bubble maps etc.Interactive charts with...
Vega is an open-source visualization grammar developed by the University of Washington Interactive Data Lab. It provides a JSON-based declarative format for creating, saving, and sharing interactive visualization designs.Some key features of Vega include:Declarative visualization specification format to concisely describe visualizationsBuilt-in support for various graphical encoding and interaction techniques like...
EJSCharts is a flexible JavaScript charting library for adding interactive charts and graphs to web applications and sites. It is built on top of the EJ2 JavaScript library and integrates seamlessly with other Syncfusion UI components.With EJSCharts, you can create over 35 chart types including line, area, bar, pie, doughnut,...
CanvasXpress is an open-source JavaScript data visualization library designed for interactive data graphing and analysis. It allows researchers and developers to create a wide variety of highly customizable data visualizations including bar charts, pie charts, dot plots, heatmaps, scatter plots, box plots, histograms, line plots, network diagrams and more.Some key...