Processing.js

Processing.js

Processing.js is a JavaScript port of the Processing visualization programming language and environment. It allows web browsers to display animations, visualizations, and interactions using the Processing syntax.
animation visualization programming processing javascript

Processing.js: A JavaScript Port of Processing for Web Browsers

A JavaScript port of the Processing visualization programming language and environment, allowing web browsers to display animations, visualizations, and interactions using the Processing syntax.

What is Processing.js?

Processing.js is an open-source JavaScript port of the popular Processing visualization programming language and environment. It allows web browsers to display animations, visualizations, and interactions using the Processing syntax and graphical capabilities.

Some key features of Processing.js include:

  • Works with modern web browsers like Chrome, Firefox, and Safari
  • Supports 2D and 3D graphics, images, typography, color, and more
  • Easy to get started for those familiar with Processing
  • Lightweight library with small file size
  • Integrates well with HTML5 Canvas, WebGL, and JavaScript
  • Has a full set of drawing, color, math, and input functions
  • Open architecture makes it easy to extend and enhance

Processing.js can be used for creating interactive sketches, data visualizations, animations, games, generative art, and more. It provides an approachable entry point to advanced visualizations and graphics on the web. The syntax is very similar to standard Processing, making it easy for current Processing developers to use.

Processing.js Features

Features

  1. JavaScript port of Processing
  2. Runs Processing sketches in web browsers
  3. Supports 2D and 3D graphics
  4. Has a full set of graphical functions
  5. Integrates with HTML5 Canvas and WebGL

Pricing

  • Open Source

Pros

Easy to learn

Large community support

Open source

Cross-platform compatibility

Interactive visualizations and animations

Cons

Performance limitations compared to native Processing

Browser support inconsistencies

Steep learning curve for non-programmers


The Best Processing.js Alternatives

Top Development and Visualization and other similar apps like Processing.js


Processing icon

Processing

Processing is an open-source computer programming language and integrated development environment (IDE) built for the electronic arts, new media art, and visual design communities with the purpose of teaching non-programmers the fundamentals of computer programming in a visual context.Processing uses a simplified syntax based on the Java language, but uses...
Processing image
Anime.js icon

Anime.js

Anime.js is a lightweight JavaScript animation library that allows developers to animate elements on a website without relying on CSS or jQuery. Some key features of Anime.js include:Animates CSS properties like color, opacity, scroll, and moreWorks with SVG, DOM attributes, and JavaScript ObjectsSimple API and small file size (16kB minified+gzipped)Playback...
Paper.js icon

Paper.js

Paper.js is an open-source vector graphics scripting framework that runs on top of the HTML5 Canvas element. It provides developers and designers high-performance tools for animation, visualizations, games, and more.Some key capabilities and features of Paper.js include:Vector graphics rendering with WebGL hardware accelerationIntuitive scene graph and hierarchical transformations systemMath utilities...
Paper.js image
AmCharts icon

AmCharts

amCharts is a feature-rich JavaScript charting library that enables you to create interactive charts, dashboards, and data visualizations. With amCharts, you can build solutions for both web and mobile platforms.Some key capabilities and benefits of amCharts include:Supports a wide variety of chart types: line, column, bar, pie, radar, scatter, gauges,...
AmCharts image
D3.js icon

D3.js

D3.js, or D3, is an open-source JavaScript library used for visualizing data with web standards. D3 stands for Data-Driven Documents. It allows developers to bind arbitrary data to the Document Object Model (DOM) and then apply data-driven transformations to the document. This allows web developers to create dynamic, interactive data...
D3.js image
P5.js icon

P5.js

p5.js is a JavaScript library for creative coding, with a focus on making coding accessible and inclusive for artists, designers, educators, beginners, and anyone else. It is based on the core principles of Processing, but rebuilt for today's web.Some key features and strengths of p5.js:Powerful graphics, image, and sound libraries...
P5.js image
FabricJS icon

FabricJS

FabricJS is an open-source JavaScript library that makes it easy to work with HTML5 canvas elements. It provides an object model on top of the canvas that allows you to manipulate shapes, objects and annotations on a canvas using a simple API.Some key features of FabricJS include:Object creation - It...
FabricJS image
Snap.svg icon

Snap.svg

Snap.svg is a JavaScript library designed specifically for working with Scalable Vector Graphics (SVG) on the web. It provides a clean, friendly API that makes it easy to create, modify, animate, and interact with SVG elements using JavaScript.Some key features of Snap.svg include:Simple API for creating SVG elements like rects,...
Snap.svg image
Cinder icon

Cinder

Cinder is an open-source block storage platform designed to provide persistent block storage for OpenStack cloud computing environments. As a core OpenStack project, Cinder integrates with OpenStack compute and networking services to provide expanded storage capabilities for virtual machines running in an OpenStack deployment.Some key capabilities and features of Cinder...
Cinder image
Context Free icon

Context Free

Context Free is a Windows and macOS application used to create recursive geometric images. It provides an accessible way for artists, designers, math enthusiasts, and programmers to create complex digital art based on geometric shapes and preset transformations.The program has an intuitive drag-and-drop interface that allows users to define rules...
Context Free image
Vis.js icon

Vis.js

Vis.js is an open source data visualization library built with JavaScript. It allows developers to create interactive visualizations such as timelines, networks and graphs easily in the browser using web standards.Some of the key features of Vis.js include:Various data visualization modules for timelines, networks, graphs etc.Easily customizable and extensible to...
Vis.js image
Smoothie Charts icon

Smoothie Charts

Smoothie Charts is an open-source JavaScript charting library designed specifically for real-time streaming data visualization. Some key features include:Optimized for line, bar, scatter, spline, and area graphs using canvasFast animation with a small code footprint suitable for embedded devicesHandles large volumes of real-time data without dropping framesCustomizable scales, interpolation modes,...
Smoothie Charts image
OpenFrameworks icon

OpenFrameworks

OpenFrameworks is an open source C++ toolkit designed to assist with creative coding projects. It provides a simple framework for working with graphics, audio, video, networking, and other media functionality using C++. Some key aspects of OpenFrameworks:Cross-platform framework that works on Windows, Mac, Linux, iOS, and Android.Open source and written...
OpenFrameworks image
UvCharts icon

UvCharts

uvCharts is an open-source JavaScript charting library for building interactive data visualizations for the web. Some key features and benefits of uvCharts include:Open source and completely free to useLightweight at only 15kB gzippedSupports a wide variety of chart types including line, bar, pie, scatter, area charts and moreExtensive customization options...
UvCharts image
Recharts icon

Recharts

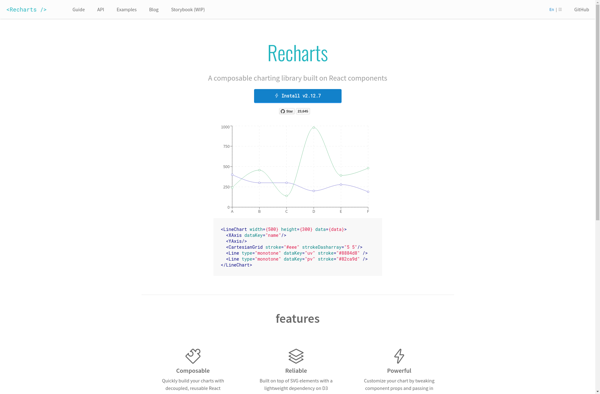
Recharts is an open-source React charting library used to build various data visualizations and interactive charts. It is Declarative, Component-Based, and highly customizable to create charts such as line, bar, pie, radar, scatter, treemap and more.Some key features of Recharts:Supports both SVG and Canvas rendering using a unified APIResponsive design...
Recharts image
Game Script icon

Game Script

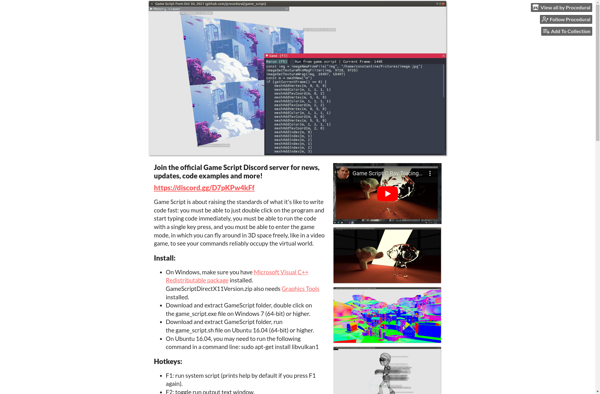
Game Script is an open-source, cross-platform game engine and integrated development environment for creating 2D and 3D video games. Originally developed by Game Company, Game Script is now maintained by an open-source community of developers.Some key features of Game Script include:Intuitive visual editors for scene building, animation, visual scripting, etc.Support...
Game Script image
Vov.css icon

Vov.css

vov.css is an open-source CSS framework designed for building responsive, mobile-first web interfaces and applications. Despite being lightweight and minimalist, vov.css aims to provide all the basic building blocks needed for most web development projects.At its core, vov.css features a 12-column grid system that adapts to multiple screen sizes, enabling...
Vov.css image
Chartkick icon

Chartkick

Chartkick is an open-source charting library for Ruby on Rails applications. It provides a simple domain-specific language for generating interactive charts and graphs without writing any JavaScript. Chartkick supports various chart types like line charts, pie charts, column charts, bar charts and more.Some key features of Chartkick:Easy integration into Rails...
Chartkick image
Generativepy icon

Generativepy

Generativepy is an open-source Python library that allows developers and researchers to easily build and train generative machine learning models. It provides implementations of popular architectures like generative adversarial networks (GANs), variational autoencoders (VAEs), and autoregressive models.Some key features of Generativepy include:Intuitive model APIs - Quickly build models by combining...
Generativepy image
Protovis icon

Protovis

Protovis is an open-source Javascript visualization library released in 2009. It provides a declarative syntax to create a variety of interactive graphical displays like bar charts, scatter plots, pie charts, trees, networks and more.Some key features of Protovis include:Simple declarative domain-specific language that allows you to bind data dynamically to...
Protovis image
Ember Charts icon

Ember Charts

Ember Charts is an open-source JavaScript charting library built for use in Ember.js applications. It provides a set of reusable Ember components and services to help developers quickly add beautiful, interactive charts and graphs to their apps.Key features of Ember Charts include:Tight integration with Ember's data layer - easily bind...
Ember Charts image
BonsaiJS icon

BonsaiJS

BonsaiJS is an open-source JavaScript graphics library for creating interactive 3D graphics in a web browser leveraging WebGL. Developed by Mozilla, BonsaiJS provides a high-level, declarative API that makes it easy for web developers to work with 3D without needing deep expertise in WebGL or OpenGL.Some key capabilities and benefits...
BonsaiJS image
StageXL icon

StageXL

StageXL is an open-source Flash runtime engine written entirely in JavaScript. It allows developers to create hardware-accelerated 2D content for the web using a Flash-like API and workflow. StageXL implements major parts of the Flash API to provide a familiar development experience for those coming from a Flash background.Some key...
StageXL image
N3-charts icon

N3-charts

n3-charts is a feature-rich JavaScript charting library for adding interactive data visualizations to web apps and sites. Developed with focus on performance, customizability and ease-of-use, n3-charts allows developers to quickly build various types of charts and graphs to effectively visualize data.With n3-charts, you can create line, bar, column, area, pie,...
N3-charts image
AnyChart icon

AnyChart

AnyChart is a feature-rich JavaScript charting library that enables developers to easily add interactive charts and dashboards to web and mobile applications. With its lightweight architecture, AnyChart aims to provide high performance chart rendering optimized even for large datasets.AnyChart supports over 80 chart types including column, bar, line, area, pie,...
AnyChart image
EJSCharts icon

EJSCharts

EJSCharts is a flexible JavaScript charting library for adding interactive charts and graphs to web applications and sites. It is built on top of the EJ2 JavaScript library and integrates seamlessly with other Syncfusion UI components.With EJSCharts, you can create over 35 chart types including line, area, bar, pie, doughnut,...
EJSCharts image